
Anaconda Recognized in insideBIGDATA’s IMPACT 50 List

We’re thrilled to announce that Anaconda has been named one of the most impactful companies in the industry by insideBIGDATA, securing the 19th position on their prestigious IMPACT 50 List. This recognition underscores our commitment to democratizing access to cutting-edge data science and AI tools. insideBIGDATA, a trusted source for news and insights in the […]
Anaconda Not Affected by Malicious xz Code
What Happened? A March 29, 2024 announcement brought to light malicious code that affects the latest version of the “xz” tools and libraries. This was an identified level 10 severity CVE. We want to take this opportunity to reassure you that Anaconda products and packages were not impacted by this incident and our customers are […]
Visual Data Analysis with Python in Excel: Using Line Charts

This is the fifth and final in a series of blog posts that teach you to analyze data using Python code in Microsoft Excel visually. If you are new to Python in Excel, you should start with my Python for Excel Analysts blog series, which covers many concepts that will be assumed in this blog series. This […]
Visual Data Analysis with Python in Excel: Using Bar Charts
This is the fourth in a series of blog posts that teach you to analyze data using Python code in Microsoft Excel visually. If you are new to Python in Excel, you should start with my Python for Excel Analysts blog series, which covers many concepts that will be assumed in this blog series. This series will […]
Visual Data Analysis with Python in Excel: Using Scatter Plots
This is the third in a series of blog posts that teach you to analyze data using Python code in Microsoft Excel visually. If you are new to Python in Excel, you should start with my Python for Excel Analysts blog series, which covers many concepts that will be assumed in this blog series. This series will […]
Visual Data Analysis with Python in Excel: Using Boxplots
This is the second in a series of blog posts that teach you to analyze data using Python code in Microsoft Excel visually. If you are new to Python in Excel, you should start with my Python for Excel Analysts blog series, which covers many concepts that will be assumed in this blog series. This series will […]
Visual Data Analysis with Python in Excel: Using Histograms
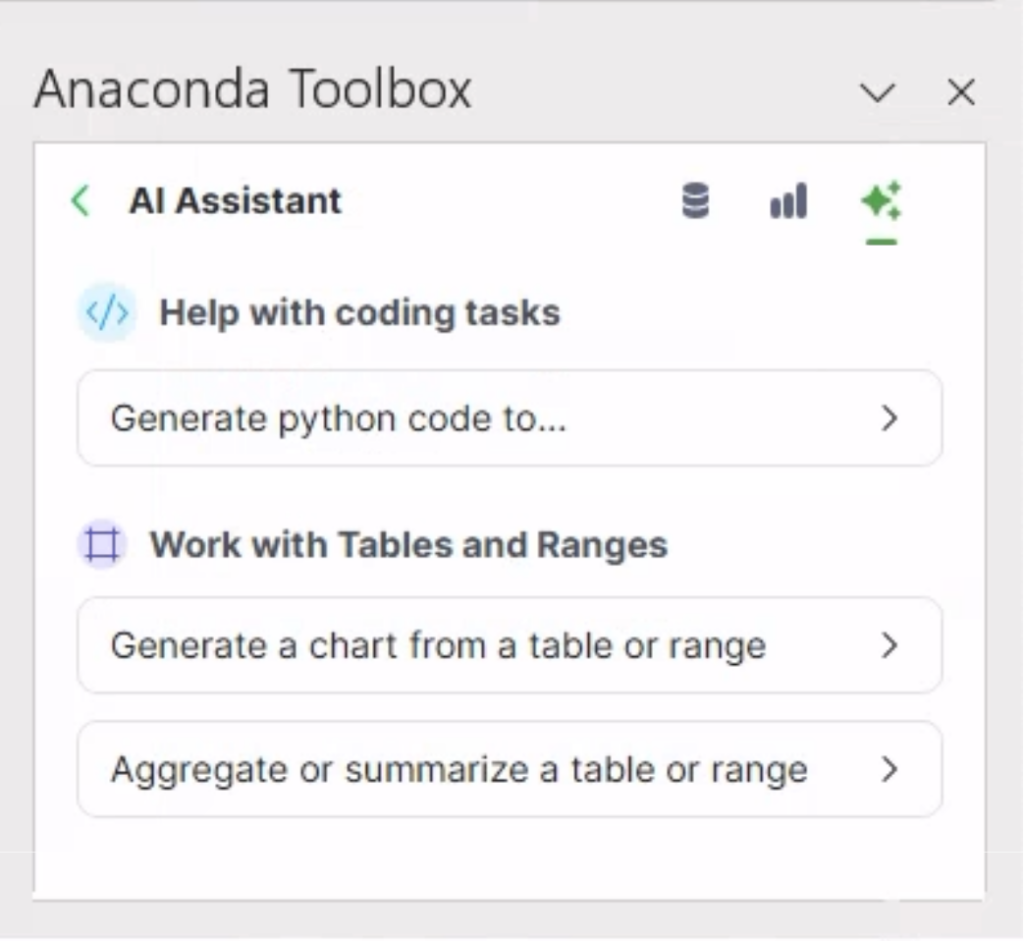
Many types of professionals analyze data using different skills. Microsoft Excel users analyze data using Excel PivotTables, while data scientists use statistical and machine learning models. Despite this diversity, Excel users, data scientists, and statisticians share one universal data analysis skill: visually analyzing data. This is the first in a five-part blog series introducing you […]
Easily manage and auto-grade your student’s coding work with EduBlocks
In the ever-evolving landscape of education technology, our educational coding platform EduBlocks is quickly becoming a critical tool within educators’ toolboxes for introducing text-based coding to their students. EduBlocks is a drag and drop block-based coding tool that helps introduce text-based coding concepts, specifically with Python, to younger students. It also features a text-only code […]
(Re) Introducing Anaconda Services
Since our founding in 2012, Anaconda has completed service projects for hundreds of clients. In fact, we started as a services-only company for the first couple of years, as we built out our Anaconda software product offerings such as the Anaconda repository. So in some sense, we have been a services company longer than we have been a software company. […]
Anaconda Repo Updates
Latest changes to Anaconda’s package repositories (repo.anaconda.com, also known as “defaults”). Python Versions currently supported in the repository: Python 3.8 Python 3.9 Python 3.10 Python 3.11 Python 3.12 COMING SOON! 2023-12-18: Miniconda 23.11.0 Miniconda3 23.11.0 is now available to download. This new release comes with updated conda 23.11.0 and conda-libmamaba-solver 23.12.0. In addition, python 3.8 […]