Anaconda Unveils the First Unified AI Platform for Open Source
A Total Economic Impact Study Reveals Organizations Building AI with Anaconda Experience 80% Improvement in Operational Efficiency and 60% Reduced Risk of Security Breaches from Addressable Attacks AUSTIN, TX (May 13, 2025) — Anaconda Inc., the leader in advancing AI with open source, today announced the release of the Anaconda AI Platform, the only unified AI platform for open […]
Quick Start Environments: Simplifying AI Development for Practitioners
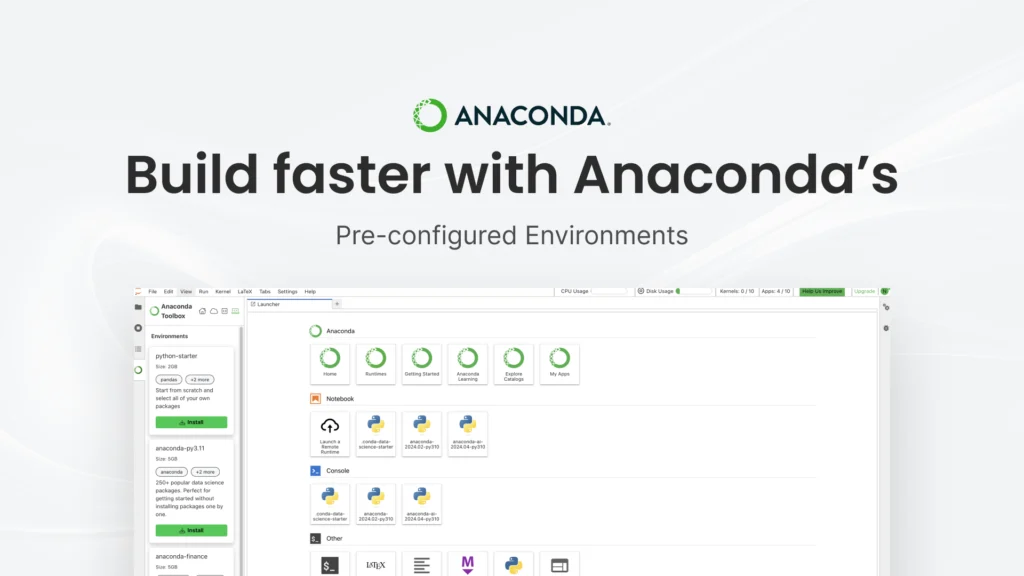
As data scientists, ML engineers, and developers, we’ve all faced the frustration of environment setup. The hours spent configuring dependencies, resolving conflicts, and ensuring everything works correctly are hours not spent on actual analysis and model development. Anaconda’s expanded quick start environments aim to eliminate this pain point entirely. What Are Quick Start Environments? Quick […]
Enterprise Open Source AI: Navigating Risk, Securing Innovation, and Owning Your Destiny
AI adoption has reached critical mass: 99% of organizations are either using AI or actively exploring it, with nearly half in the scaling phase, according to Enterprise Strategy Group research. Yet alongside this growth, risks persist: hallucinations, unscalable deployments, shadow AI, and security vulnerabilities that threaten even promising projects. “Enterprises need to be really smart […]
Newsletter Sign Up
Anaconda Newsletter Sign up for the Anaconda newsletter to be the first to hear about exciting news and content. Read Past Issues Anaconda Newsletter Be the first to hear about exciting news and content.
Illuminating Our Energy Future: How AI and Data Visualization Can Drive Sustainability Insights
At Anaconda, we believe that accessible tools for data analysis empower individuals to discover insights that can lead to meaningful change. As Earth Day nears, considering how data and artificial intelligence can illuminate our understanding of critical infrastructure and environmental impact is top of mind. The democratization of data science through intuitive AI interfaces particularly […]
Selecting an Enterprise Platform for Python and Open Source: A Checklist for Buyers

Introduction Marc Andreessen famously opened an August 2011 blog article with this provocative sentence: “Software is eating the world.” His prediction was that software development would disrupt traditional industries. Indeed, companies like Airbnb, Netflix, and Uber emerged as just a few of many winners in the “on-demand” economy that disrupted industries like travel, entertainment, and […]
Open Source Growth at Anaconda in 2025: Building the Foundations for AI Innovation
Open source software powers the data science and AI revolution, providing the essential tools that researchers, developers, and organizations rely on daily. At Anaconda, we don’t just use open source—we’re actively building its future. In 2024 alone, our teams contributed thousands of commits across dozens of critical projects that millions of Python users depend on. […]
Anaconda Learning Domain Change Frequently Asked Questions

In addition to announcing the formation of the GPU Open Analytics Initiative with H2O and MapD, today, we are pleased to announce an exciting collaborati…
The Definitive Guide to AI Platforms for Open-Source Data Science and ML
Artificial intelligence (AI) is undeniably and rapidly transforming life as we know it. Leading tech companies are investing heavily, and Google CEO Sundar Pichai has compared the impact of AI to electricity and fire. Organizations that have adopted AI to improve products and services are seeing significant financial returns on their investments. We are just beginning […]
Business Plan
Anaconda Business Plan See Pricing PREFERRED BY USERS 47M+ Global Users Number of active users in one of the largest open-source Python communities BUILT FOR THE ENTERPRISE 250K+ Organizations Rely on Anaconda to drive innovation, including 90% of the Fortune 500 POWERED BY THE COMMUNITY $40M+ to OSS Investments in open-source innovation and maintenance The […]