Python for Excel Analysts: Working with Columns

Dave Langer

This is the second in a series of blog posts that teaches you how to work with tables of data using Python code. This post introduces you to working with the columns of pandas DataFrame objects. 

If you’re unfamiliar with the pandas library, check out Part 1 (The Basics) of this blog series.

Each post in the series has an accompanying Microsoft Excel workbook to download and use to build your skills. This post’s workbook is available for download here.

For convenience, here are links to all the blog posts in this series:

Note: To reproduce the examples in this post, install the Python in Excel trial. If you like this blog series, check out my Anaconda-certified course, Data Analysis with Python in Excel.

Accessing Columns

The last blog post in this series provided an overview of how data tables are represented in Python using the pandas library. You also learned how your Microsoft Excel knowledge maps to Python code. 

Mapping your Excel knowledge to Python will be a recurring theme throughout this series. Just as you use functions with columns of data in Excel, you do the same when writing Python code. 

For example, it is common in Excel to apply a function to a column to clean data or to calculate some value (e.g., the average). You will do the same using Python code as you move into more advanced data analysis scenarios (e.g., cluster analysis).

You have several options for accessing the columns of pandas DataFrame objects. This blog post will focus on one of the most flexible options, while later blog posts will cover other approaches.

Consider how you would write Excel code to access the SalesAmount column of the InternetSales table:

Fig 1 – Excel code to access the SalesAmount column of the InternetSales table

The above Excel formula treats SalesAmount (a column) as an attribute of the InternetSales object (a table). DataFrame objects work similarly. 

The following Python code accesses SalesAmount (a pandas Series) of the internet_sales object (a DataFrame):

Fig 2 – Python code to access the SalesAmount column of the internet_sales DataFrame

DataFrames provide access to columns via the use of square braces. When using this option, you provide the column name you wish to access as a quoted string. 

The Python coding convention is to use single quotes, but using double quotes (e.g., “SalesAmount”) is also valid.

The prime benefit of accessing DataFrame columns this way is that complex column names (e.g., names with spaces) are supported.

You can also use square brackets to access multiple columns simultaneously. However, this requires you to use what is known as a Python list. A Python list is a way of declaring a collection of values.

For more information on Python lists, check out this course from Anaconda.

The following Python code accesses both the TotalProductCost and SalesAmount columns of the internet_sales DataFrame:

Fig 3 – Accessing multiple DataFrame columns with a Python list

The Python code above has a nested pair of square braces. The inner pair of square braces creates the Python list containing two values:

  • ‘TotalProductCost’
  • ‘SalesAmount’

Python lists are commonly used when writing pandas code. You will see more examples in later blog posts. For simplicity, this post will only work with one DataFrame column (i.e., a pandas Series object) at a time.

Working with Numeric Columns

As an Excel analyst, you commonly work with columns of numbers. When working with a new dataset, it is common to calculate summary statistics for the numeric columns. Using summary statistics provides insights into the distribution of values within the numeric column.

Some examples of summary statistics include:

  • The count of values
  • The minimum value
  • The average value
  • The maximum value

Summary Statistics with Excel

The following Excel code shows calculating summary statistics for the SalesAmount column of the InternetSales table:

Fig 4 – Calculating summary statistics with Excel code
Fig 5 – The calculated summary statistics

The output of Fig 5 tells us that the minimum SalesAmount is $2.29 and the average SalesAmount is $486.087. Even with just two summary statistics calculated, we’ve already learned a lot about the SalesAmount column:

  • Sales can be relatively small compared to the average.
  • The distribution of SalesAmount values might be skewed.

Summary Statistics with Python

Conceptually, calculating summary statistics using the pandas library in Python is the same as with Microsoft Excel—you request that a function be run on a collection of values. The Python function names are often the same as in Excel!

Here’s an example of finding the minimum value of the SalesAmount column using Python.

First, use the PY() function to create your Python formula:

Fig 6 – Calling the Excel PY() function

Next, when you type the “(“ the cell will indicate it contains Python code:

Fig 7 – An Excel Python cell

You can use the min() method of a pandas Series object to get the minimum value contained within a column:

Fig 8 – Calling the min() method of the pandas Series object

Hitting <Ctrl+Enter> on your keyboard runs the Python code and produces the output:

Fig 9 – Python code output for Fig 5

Another name for the average is mean. The following Python formula uses the mean() method of the pandas Series to calculate the average of the SalesAmount column:

Fig 10 – Calling the mean() method of the pandas Series object

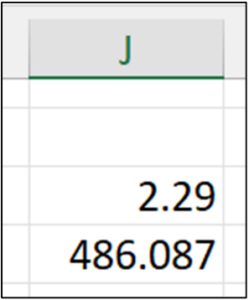
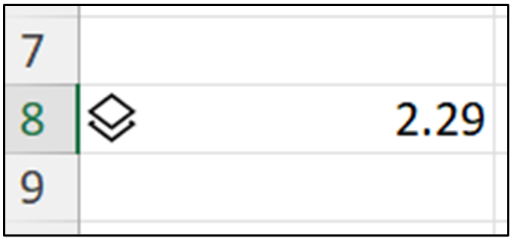
Running the above Python formula with <Ctrl+Enter> produces the following output:

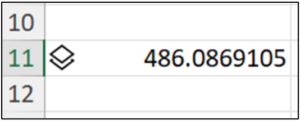
Fig 11 – Python code output for Fig 6

As the above illustrates, pandas code for calculating summary statistics is very similar to Excel code. While the above examples are simple, what’s important is the pattern of Python code you use when working with pandas Series objects. 

In a later blog post, you will learn how to create new columns in a DataFrame from existing columns to provide more insight into the data. This process is known as feature engineering and builds on the skills you’ve learned in this post.

Describing a Numeric Column with Python

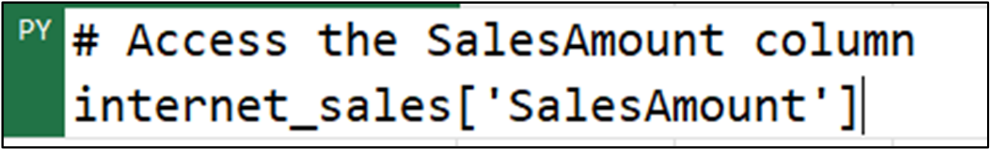
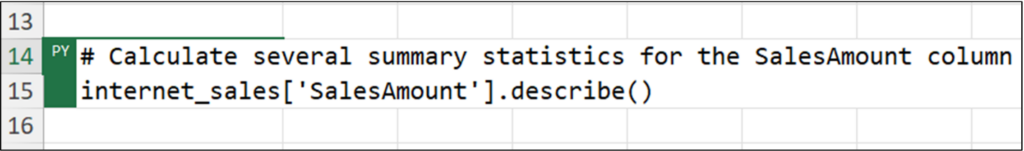
The pandas Series data type provides a handy method for calculating several summary statistics—the describe() method. The following code calls the describe() method on the SalesAmount column:

Fig 12 – Calling the describe() method of the pandas Series object

Running the Python formula will produce a new pandas Series object containing the calculated summary statistics. Using your mouse, hover over the card:

Fig 13 – Hovering your mouse over the card

Clicking the card will display the contents of the Series object:

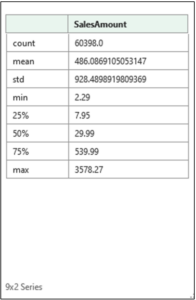
Fig 14 – The card for the describe() Series object

The Series object returned by the describe() method provides a wealth of information regarding the SalesAmount column and is quicker/easier than writing many Excel formulas to call the corresponding Excel functions:

  • Of the 60,398 values, 50% are below $30 – despite the average value being $486.087.
  • 75% of the values are below $540.
  • The SalesAmount column is skewed with many small values and relatively few large values.

Many more methods are available for working with numeric pandas Series objects. See the online documentation for more information.

Working with Text Columns

Text is a common form of business data. Textual data comes in many forms—product names, geographies, addresses, etc. In Python the term string is used to refer to textual data.

Cleaning and transforming string data is very common. It’s likely that in your work as an Excel analyst, you’ve had to wrangle string data before it could be used in analyses. Some common examples of wrangling string data include:

  • Transforming strings to be upper/lowercase
  • Extracting substrings
  • Replacing parts of strings
  • Removing special characters

String Wrangling with Excel

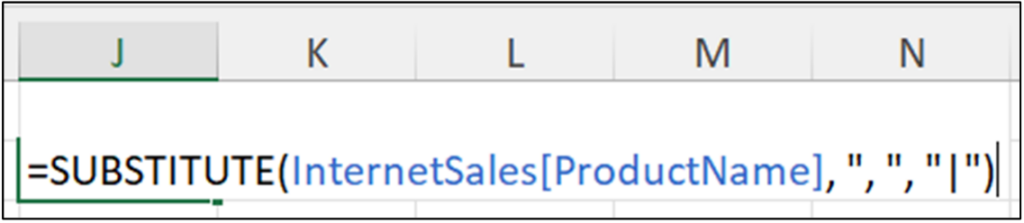
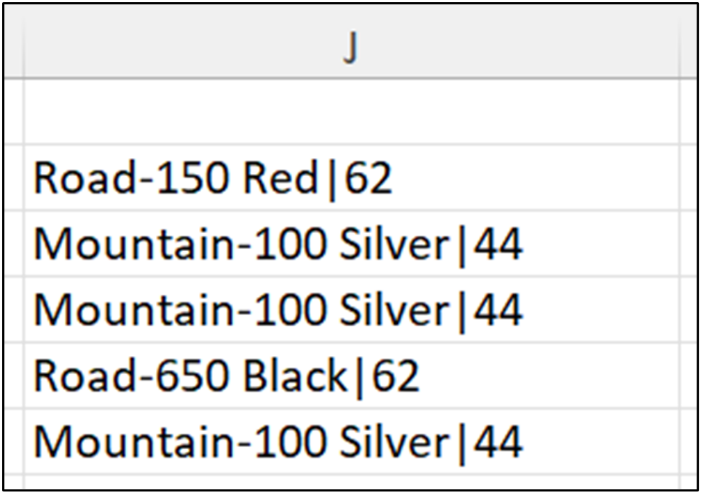
The following Excel code shows a common data wrangling scenario when working with string data—removing commas.

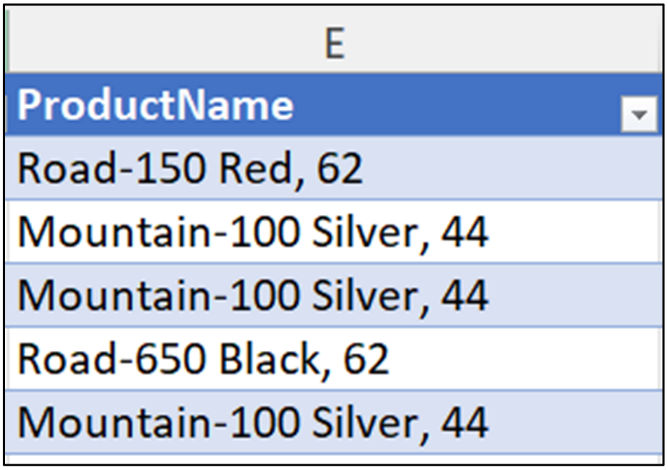
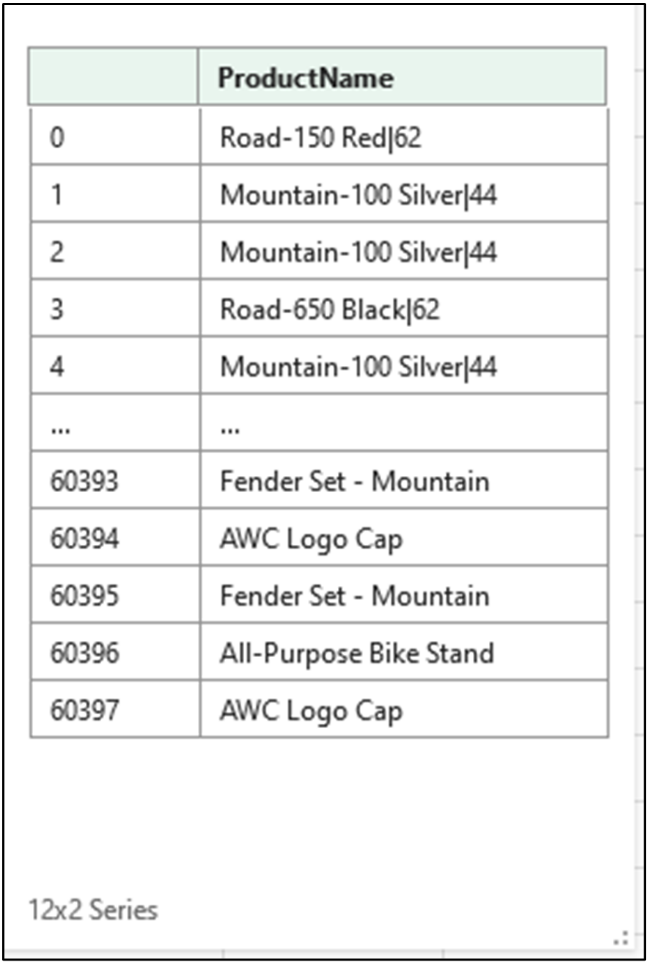
The ProductName column of the InternetSales table is string data that contains commas:

Fig 15 – The ProductName column of the InternetSales table

The following Excel code replaces every instance of a comma followed by a space (i.e., “, ”) with the pipe character (i.e., “|”) contained in the ProductName column:

Fig 16 – Excel code to remove commas from the ProductName column

This type of string wrangling is common when data is shared using comma-separated values (CSV) files.

Running the above Excel code produces the following output:

Fig 17 – ProductName data with commas replaced by pipes

All the string wrangling operations performed in Excel are available using Python. To use Python for string wrangling, you need to map your Excel knowledge to the applicable pandas Series methods.

String Wrangling with Python

When performing string wrangling using pandas Series objects, the first step is to use the str attribute. Using the str attribute gives you access to the methods you need to perform string wrangling:

Fig 18 – Access the str attribute of the ProductName column

The replace() method provides functionality like Excel’s SUBSTITUTE() function. The following code replaces every instance of “, ” with “|”:

Fig 19 – Python code to remove commas from the ProductName column

The replace() method returns a new pandas Series object containing the wrangled string data. This is like what you saw above in the Excel worksheet after running the SUBSTITUTE() function.

The above Python code stores the new Series object in a variable named prod_name_clean. Using a named variable allows you to easily reuse the object in later Python formulas you might write.

You can inspect the contents of this object by hovering over the card in the cell with your mouse and clicking. Excel will provide a preview of the contents of the prod_name_clean Series object:

Fig 20 – The card for the wrangled ProductName data

Convenient, right? Given how common string data is in analytics, the str attribute provides many methods for working with string data. For more information, check out the online documentation.

What’s Next?

This blog post has been a brief introduction to working with the columns (i.e., Series objects) of DataFrames.

The pandas Series data type offers comparable functionality to Microsoft Excel for working with columns of data. For example, the Series data type offers complete functionality for working with date/time data. 

Working with pandas DataFrame and Series objects is a fundamental skill for more advanced Python data analysis scenarios like visualizations, predictive modeling, and cluster analysis. 

The next post in this series will introduce you to another fundamental concept in working with data tables: filtering.

If you want to learn more about working with data tables using pandas, take this beginner course for an Introduction to pandas for Data Analysis, and check out the official pandas user guide.

Disclaimer: The Python integration in Microsoft Excel is in Beta Testing as of the publication of this article. Features and functions are likely to change. Don’t hesitate to reach out if you notice an error on this page. 

Bio

Dave Langer founded Dave on Data, where he delivers training designed for any professional to develop data analysis skills. Over the years, Dave has trained thousands of professionals. Previously, Dave delivered insights that drove business strategy at Schedulicity, Data Science Dojo, and Microsoft.

Talk to an Expert

Talk to one of our financial services and banking industry experts to find solutions for your AI journey.

Talk to an Expert