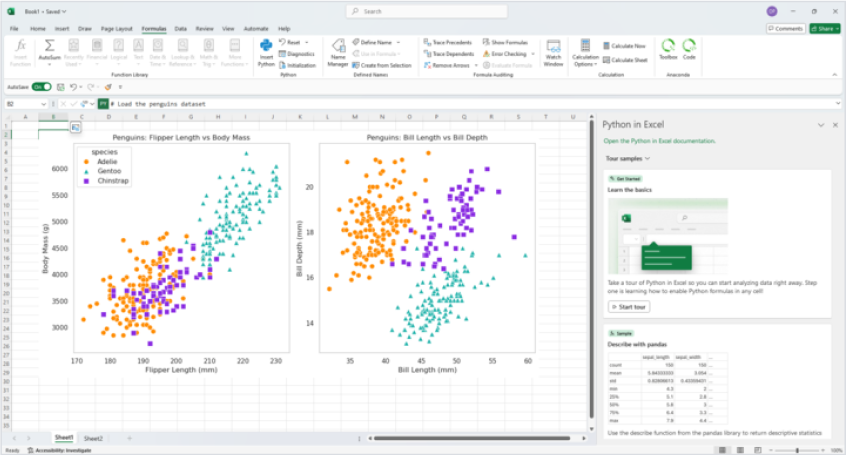
Python in Excel
Harness the Power of Python in Microsoft Excel’s Familiar Interface
Next level data analysis from Anaconda and Microsoft Excel
The world’s most popular data application meets the world’s most trusted Python distribution.
Do More with your data
Use popular Python libraries within Excel for complex data analysis and modeling.
Create Custom Visualizations
Explore, manipulate, and present data like never before.
Streamline Your Data Preparation
Simplify complex data transformations and boost productivity while minimizing manual effort.
Share Work Effortlessly
Your work becomes more accessible, easier to understand, and easier to reproduce.

Self-Paced Learning Courses

Data Analysis with Python in Excel
Leverage the power of Python to supercharge your data analysis tasks within Excel.

Machine Learning with Python in Excel
Explore the full potential of machine learning using Python and scikit-learn within Excel workbooks.
Python in Excel Resources

Courses and Certifications
Discover Next-Level Capabilities with Toolbox
Unlock even more capabilities with Python in Excel with the Anaconda Toolbox add-in for Excel
Learn On Our Expertise
Anaconda Assistant is your personal guide to writing better code.
Share Your Data Easily
Unlock the value of your data: streamline access, collaboration, and insights with our dynamic data connectors.
Bring Your Code Where You Need It
Carry your code between workbooks using code snippets.
Tell a Story with Your Data
Seamlessly craft stunning visualizations that inspire and inform using seaborn.
Python in Excel Frequently Asked Questions
What is Python in Excel?
Python in Excel makes it possible to natively combine Python and Excel analytics within the same workbook – with no setup required. With Python in Excel, you can type Python directly into a cell, the Python calculations run in the Microsoft Cloud, and your results are returned to the worksheet, including plots and visualizations.
Why do I need Python in Excel?
Python in Excel lets you run Python code directly in the Excel formula bar. For Excel users, this enables new and powerful analysis and visualization capabilities. For Python users, this makes your Python code easier to share with your Excel-using colleagues, and you can avoid jumping back and forth between Excel and Jupyter notebooks.
How do I get access to Python in Excel?
Take the following steps to use Python in Excel:
- Open a blank workbook.
- Select Formulas in the ribbon.
- Select Insert Python.
Is Python Excel available to all Microsoft users?
Python in Excel is rolling out to Excel users for Windows first, and then to other platforms at a later date.
How is Anaconda contributing to Python in Excel?
Anaconda is integrating the Anaconda Distribution for Python within Excel. This provides the core Python functionality plus access to over 400 curated packages, enabling advanced data analysis and Python data visualization directly within your Excel workbook.
What is a package/library/distribution?
Python is an ecosystem consisting of the core language and hundreds of thousands of third-party libraries, also referred to as packages, developed independently. A distribution, like the Anaconda Distribution for Python, is a subset of those third-party libraries collected into an installable software package.
What does “import” mean?
In Python, the statement “import” is used to bring additional functionality into your code. It allows you to access methods and tools provided by third-party libraries or packages.
Which Python packages should I use in Excel?
To get the most out of Python in Excel, start with these packages:
- pandas for working with tables
- Matplotlib and seaborn for creating charts (seaborn is more beginner friendly, while Matplotlib offers more customization)
- statsmodels or SciPy for statistical analysis
- scikit-learn for machine learning
These are a great starting point, with plenty of others to explore as you progress.
How do I write Python in the grid?
There are several ways you can write Python into the Excel grid:
- In the cell type =PY( and start writing your Python code.
- In the formula bar, you can click the Python button
- Hold (Ctrl+Alt+Shift+P) and the cell will automatically convert to using Python
Is Python in Excel safe?
What is a DataFrame?
A DataFrame is a representation of tabular data organized by rows and columns. The pandas Python library reads tabular data in many formats like Excel or CSV and creates a DataFrame object. The DataFrame can then be used to perform exploratory analysis or data processing in Python.
Visit pandas.pydata.org for more information
How can I do VLOOKUP operations with Python and pandas?
Why do my Python cells change after every edit? Excel formulas do not.
We do this to guarantee that we give you the latest results every time. If you would like to reduce the frequency of calculation, consider using partial mode or manual mode which will only recalculate each cell until you request it. You can change the mode by going to Formulas > Calculation > Calculation Options.
Is the Anaconda Toolbox the same as Python in Excel?
The Anaconda Toolbox provides tools to supplement and assist your Python in Excel work. By using Anaconda Toolbox, Python in Excel users can take full advantage of all the capabilities Microsoft Excel and Python have to offer, while learning Python along the way.
Why did Microsoft partner with Anaconda on Python in Excel?
With more than 43 million users, Anaconda is the most popular operating system for AI, providing access to the foundational open-source Python packages used in modern AI, data science, and machine learning through a seamless platform. We pioneered the use of Python for data science, championed its vibrant community, and continue to steward open-source projects that make tomorrow’s innovations possible.
What resources can help me learn how to use Python in Excel?
Anaconda and Microsoft have created a variety of resources to help you take advantage of all Python in Excel has to offer. Here are some resources to get you started: