As a Microsoft Excel analyst, you know that data tables are the raw materials of any analysis. It doesn’t matter if the raw materials are tabular worksheet data, Excel tables, or PivotTables. Everything in analytics starts with a table.
Similarly, your Python journey starts with data tables. This is the first of a series of blog posts designed to quickly teach you how to work with data tables using the pandas Python library.
Each post will also have an accompanying Microsoft Excel workbook to download and use to build your skills. This post’s workbook is available for download here.
For convenience, here are links to all the blog posts in this series:
While most Excel analysts don’t think of it this way, writing code is a common aspect of analyzing data using Microsoft Excel.
You regularly write formulas while analyzing data with Excel. Sometimes your formulas might be simple (e.g., calculating the average of a column). Sometimes your formulas might be complex (e.g., nested IF() function calls).
Regardless of the formula complexity, it’s all code. This coding knowledge makes learning Python easier than you might think.
Everything in Python Is an Object
Python is an object-oriented programming (OOP) language. What this means is very simple. When you write Python code, your code interacts with Python objects. Everything in Python is considered an object.
Here’s the good news.
You’re already familiar with writing code using objects as an Excel analyst. Ever write Excel formulas using tables? Then you’ve written code using objects!
Excel Tables Are Objects
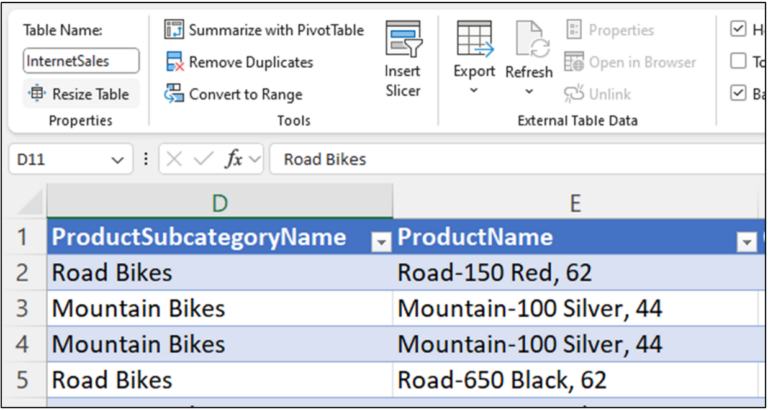
This blog post will use the following Excel table as a running example:
Fig 1 – The InternetSales table
Tables in Excel are “things” (i.e., objects) that you use when you code formulas. For example, Excel tables have names (e.g., InternetSales) and columns (e.g., SalesAmount) used in your formulas.
Imagine you wanted to calculate the average of the InternetSales table’s SalesAmount column. You can code this easily as follows:
Fig 2 – Using an Excel table in a formula
In this little bit of formula code, a lot is going on. Conceptually, here’s what happens when you hit <Enter> on your keyboard and the formula is executed:
Excel locates the InternetSales table (an object).
Then Excel locates the SalesAmount column (another object).
The data from the SalesAmount column is passed to the AVERAGE() function.
The AVERAGE() function verifies that the data is numeric.
The AVERAGE() function performs the computation and returns the result.
Fig 3 – The formula results
The above is just one example of where you write Excel code to perform operations using objects.
Introducing pandas
Unlike Microsoft Excel, Python doesn’t come out of the box with objects representing data tables. The pandas library was created to extend Python’s functionality to include working with data tables, much like you do in Excel.
Over the years, the pandas library has become the de facto standard when working with data tables in Python. Your knowledge of Excel data tables makes learning how to work with pandas straightforward.
You can think of Python libraries (e.g., pandas) like Excel Add-ins. You can extend Excel’s functionality using Add-ins (e.g., Solver and Power Pivot). However, by default, Excel Add-ins are not enabled – you must tell Excel to load Add-ins explicitly.
Similarly, you must tell Python to load the libraries you want to use. Loading the pandas library is one of the most common things Python coders do in their code.
However, because the pandas library is so useful, Microsoft Excel automatically loads pandas for you.
Making pandas Behave
Like everything in Python, pandas data tables are objects. Python objects have attributes (e.g., a name) and can perform operations (e.g., calculating the average).
The easiest way to understand these concepts is to compare Excel code to Python code. An Excel formula is code composed of objects, attributes, and functions (i.e., operations).
You can map these concepts to the previous formula code:
Fig 4 – Decomposing Excel code into objects, attributes, and functions
Fig 4 – Decomposing Excel code into objects, attributes, and functions
The formula code above applies an operation (i.e., the AVERAGE() function) to the SalesAmount attribute of the InternetSales object.
The following pandas Python code accomplishes the same result:
Fig 5 – Equivalent Python code for the Excel formula of Fig 4
The first line of Python code starting with a hashtag (“#”) is a comment. Comments are used in Python as documentation for humans. Be sure that your Python code is commented well. Your future self will thank you!
In case you are unfamiliar, the word “mean” is another name for “average.” Also, per Python coding practices, the table’s name has been changed to internet_sales.
Take a moment and compare the Excel code to the Python code. Notice how the function comes first in the Excel macro, but the object comes first in Python? This is an example of how Python is object-oriented.
The above code also illustrates an important aspect of coding with objects. SalesAmount is also an object (i.e., a column). In both Excel and Python, objects can contain other objects.
Python Objects Have Types
A critical concept in Python programming is the concept of data types. Python data types are like data formats in Microsoft Excel. Both Excel data formats and Python data types determine what is possible with your code.
Take the ProductName column of the InternetSales Excel table as an example:
Fig 6 – The ProductName column of the InternetSales table
The appropriate Excel data format for this column is Text. By specifying the data format, you tell Excel the nature of the data in the column, and this limits what kinds of operations (e.g., functions) can be performed on the data.
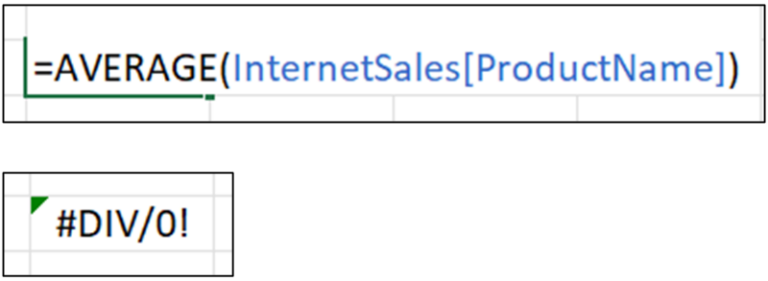
For example, calling the AVERAGE() function on the ProductName column will generate the following error:
Fig 7 – Calling the AVERAGE() function on a Text column produces an error
Every object in Python has a data type, and just like with Excel data formats, Python data types determine which operations are valid for an object.
Python data types will be a recurring theme throughout this blog series. The two most important data types for this post are pandas DataFrames and Series.
The pandas DataFrame Data Type
Classes define data types in Python. A class is a collection of Python code that defines the attributes possessed by an object and what operations can be performed by an object.
Python classes provide the blueprints from which objects are constructed.
The pandas DataFrame class is the data type that represents an entire data table. DataFrame objects are very much like tables in Microsoft Excel. For example, DataFrames have names and columns.
All actions commonly taken with Excel tables can be done with DataFrames.
You can combine DataFrames (think VLOOKUP/XLOOKUP). You can perform calculations on DataFrame columns. You can filter DataFrames.
This blog series will teach you how to perform all these common operations using Python code.
The pandas Series Data Type
The pandas Series class is the data type that represents a single column of data. A DataFrame object contains one Series object for each column of data in the data table.
The Series class offers many operations (i.e., functions) for working with columns of data. For example, the Python code of Fig 5 uses the mean() method of the Series class.
The Series class also represents the rows of DataFrame objects. While pandas supports working with rows of data, the bulk of the pandas code you write works with columns.
Your First DataFrame
When you execute Python code within your Excel workbooks, Python runs in a cloud container that is very restricted in what it can do.
Your Python code cannot access the Internet, and it cannot access the files on your computer. Essentially, the workbook is the entire universe as far as Python is concerned.
Given these limitations, it isn’t surprising that constructing a pandas DataFrame (e.g., from an Excel table) is a very common first step when using Python in Excel.
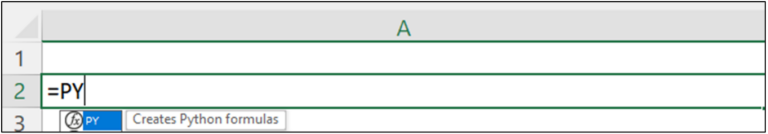
Constructing a pandas DataFrame object from an Excel table is straightforward. You use the new PY() function to construct the Python formula that contains the Python code:
Fig 8 – Using the PY() function to create a Python formula
Once you type the open parenthesis (i.e., “(“), the Excel formula editor will change, and you can enter your code:
Fig 9 – Constructing a pandas DataFrame from an Excel table
Here’s how the second line of code works:
The xl() function is used to ingest data from Excel and create a pandas DataFrame object.
The first parameter specifies where the data is located. In this case, the data is located in the InternetSales Excel table.
The first parameter also specifies using all the InternetSales table columns via “[#ALL].”
The second parameter tells the xl() function that headers (i.e., column names) are present in the data.
The DataFrame object returned by the xl() function is stored in a variable named internet_sales. You can access the DataFrame object in later Python formulas using this name.
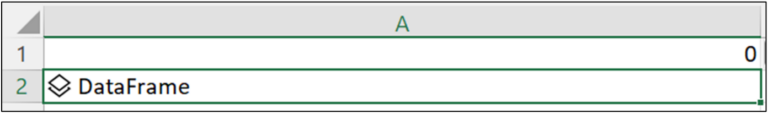
Hit <Ctrl+Enter> on your keyboard to execute the Python formula. The code might take a few seconds to run. Assuming your code had no errors, here’s what you will see:
Fig 10 – Successfully loading a pandas DataFrame from an Excel table
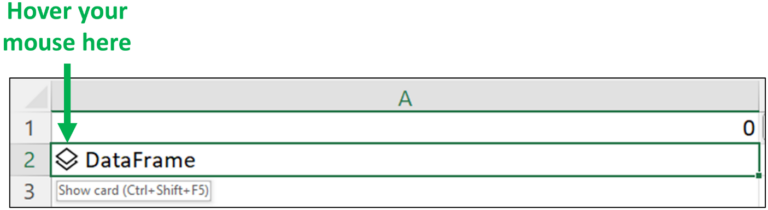
You can get a glimpse of the data stored in the DataFrame object by hovering your mouse over the card in the cell:
Fig 11 – Hovering your mouse over the card of a Python formula cell
Cell cards provide previews of Python objects created by Python formulas. With your mouse hovering over the above card, clicking on the card displays the object preview of internet_sales:
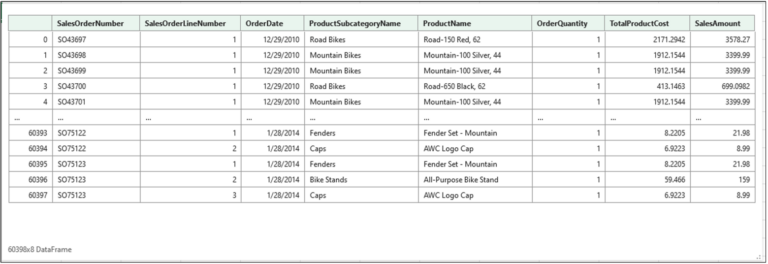
Fig 12 – The card for the internet_sales object
The card above shows the first five and last five rows of the internet_sales data. The card also shows that the DataFrame consists of 60,398 rows and eight columns of data.
What’s next?
With the skills you gained from this blog post, you can move on to the next post on performing operations on the columns of DataFrame objects.
Disclaimer: The Python integration in Microsoft Excel is in Beta Testing as of the publication of this article. Features and functions are likely to change. Don’t hesitate to reach out if you notice an error on this page.
Author Bio
Dave Langer founded Dave on Data, where he delivers training designed for any professional to develop data analysis skills. Over the years, Dave has trained thousands of professionals. Previously, Dave delivered insights that drove business strategy at Schedulicity, Data Science Dojo, and Microsoft.
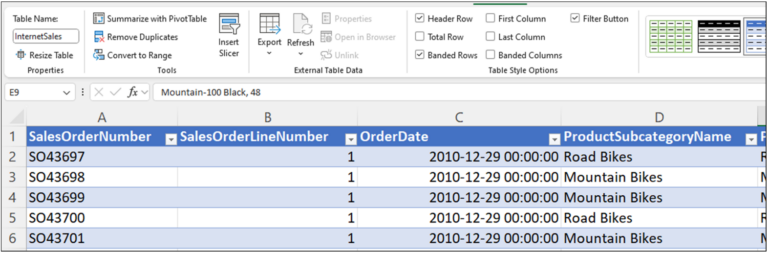
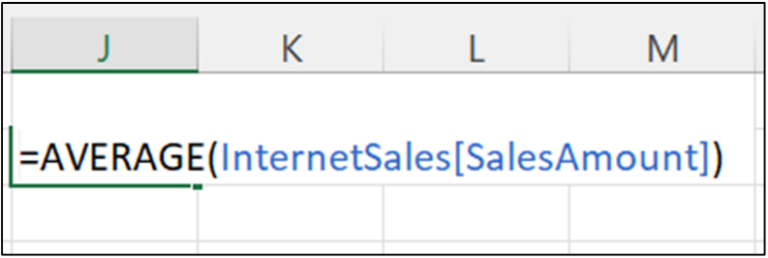
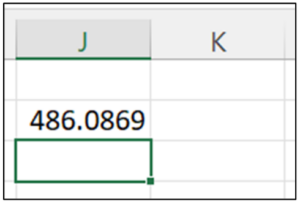 Fig 3 – The formula results
The above is just one example of where you write Excel code to perform operations using objects.
Fig 3 – The formula results
The above is just one example of where you write Excel code to perform operations using objects.
 Fig 4 – Decomposing Excel code into objects, attributes, and functions
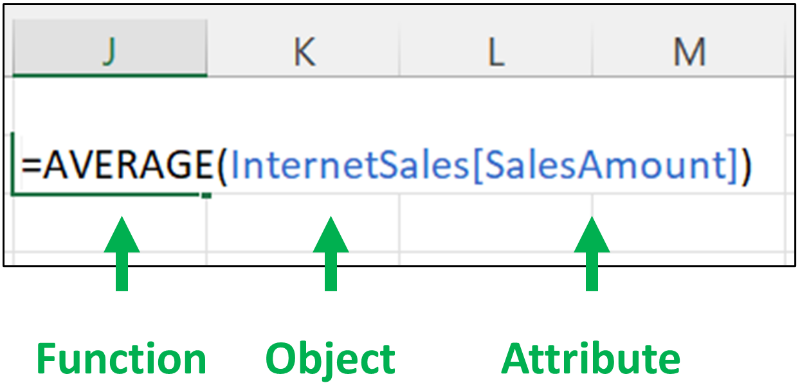
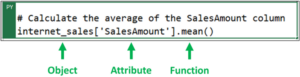 Fig 5 – Equivalent Python code for the Excel formula of Fig 4
The first line of Python code starting with a hashtag (“#”) is a comment. Comments are used in Python as documentation for humans. Be sure that your Python code is commented well. Your future self will thank you!
In case you are unfamiliar, the word “mean” is another name for “average.” Also, per Python coding practices, the table’s name has been changed to internet_sales.
Take a moment and compare the Excel code to the Python code. Notice how the function comes first in the Excel macro, but the object comes first in Python? This is an example of how Python is object-oriented.
The above code also illustrates an important aspect of coding with objects. SalesAmount is also an object (i.e., a column). In both Excel and Python, objects can contain other objects.
Fig 5 – Equivalent Python code for the Excel formula of Fig 4
The first line of Python code starting with a hashtag (“#”) is a comment. Comments are used in Python as documentation for humans. Be sure that your Python code is commented well. Your future self will thank you!
In case you are unfamiliar, the word “mean” is another name for “average.” Also, per Python coding practices, the table’s name has been changed to internet_sales.
Take a moment and compare the Excel code to the Python code. Notice how the function comes first in the Excel macro, but the object comes first in Python? This is an example of how Python is object-oriented.
The above code also illustrates an important aspect of coding with objects. SalesAmount is also an object (i.e., a column). In both Excel and Python, objects can contain other objects.