Now you can write Python code directly in Microsoft Excel’s grid—no Python installation required.
Today, Anaconda and Microsoft announced a groundbreaking innovation: Python in Excel. This marks a transformation in how Excel users and Python practitioners approach their work.
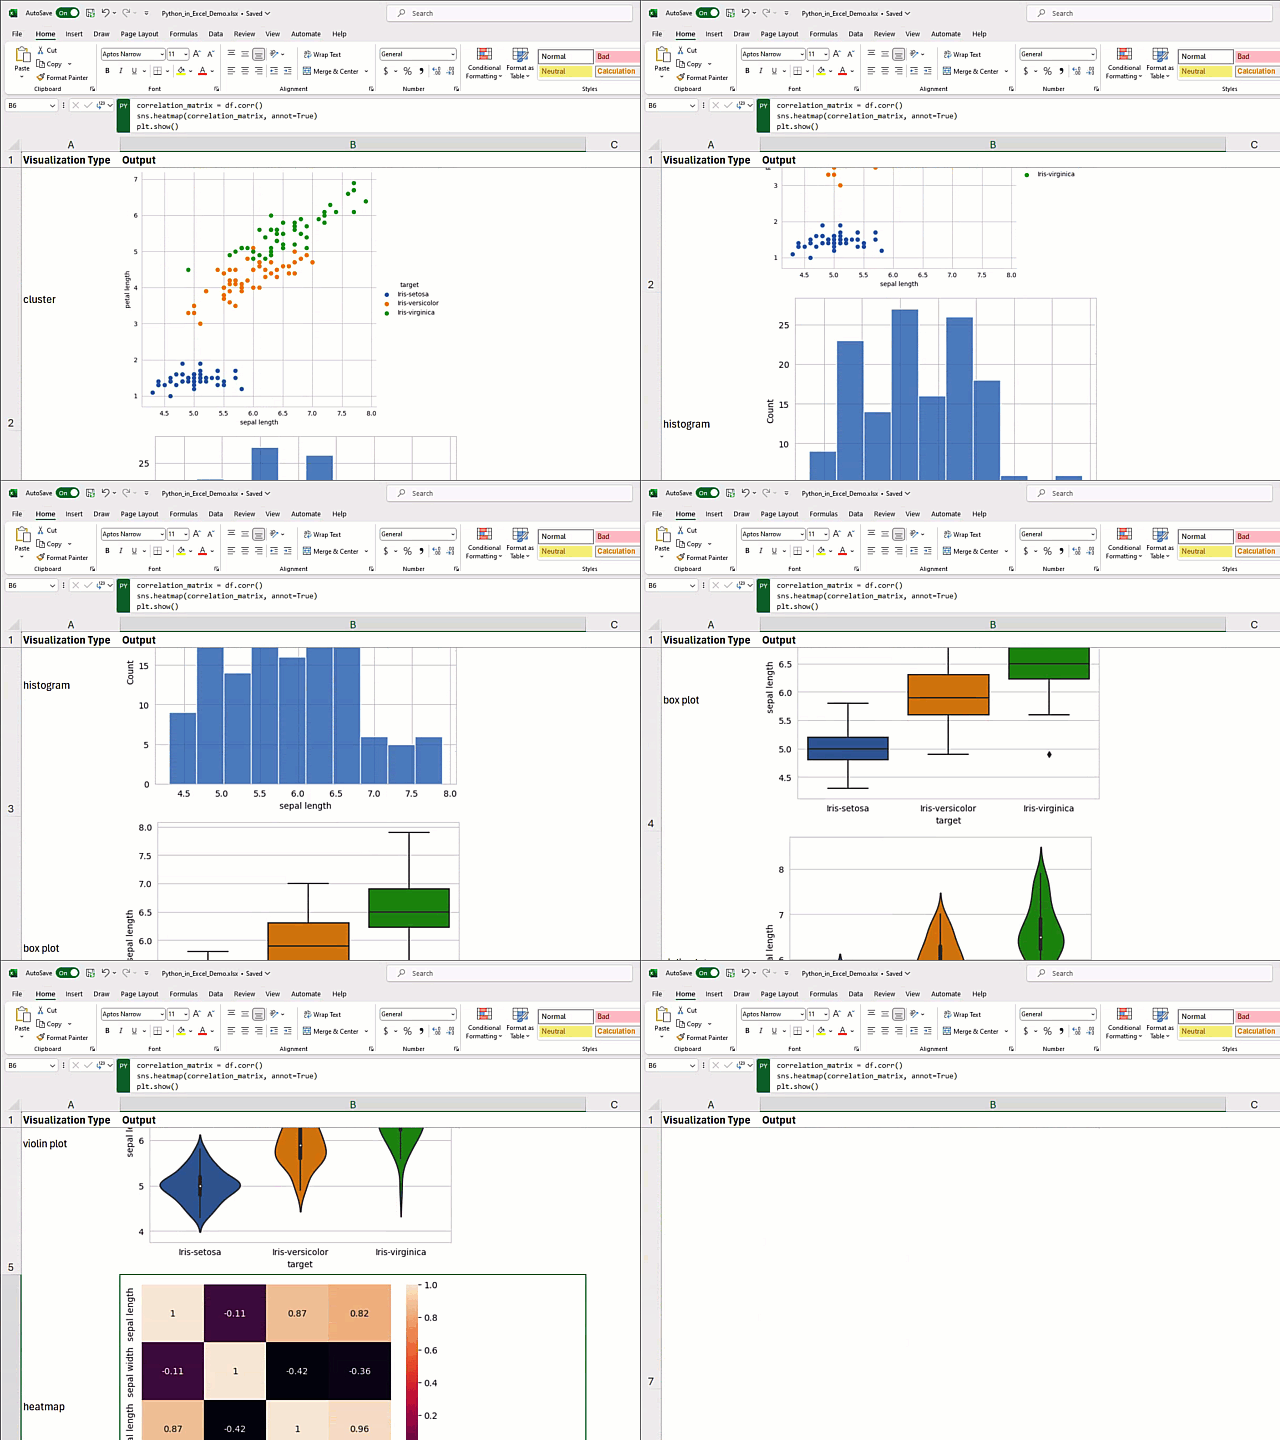
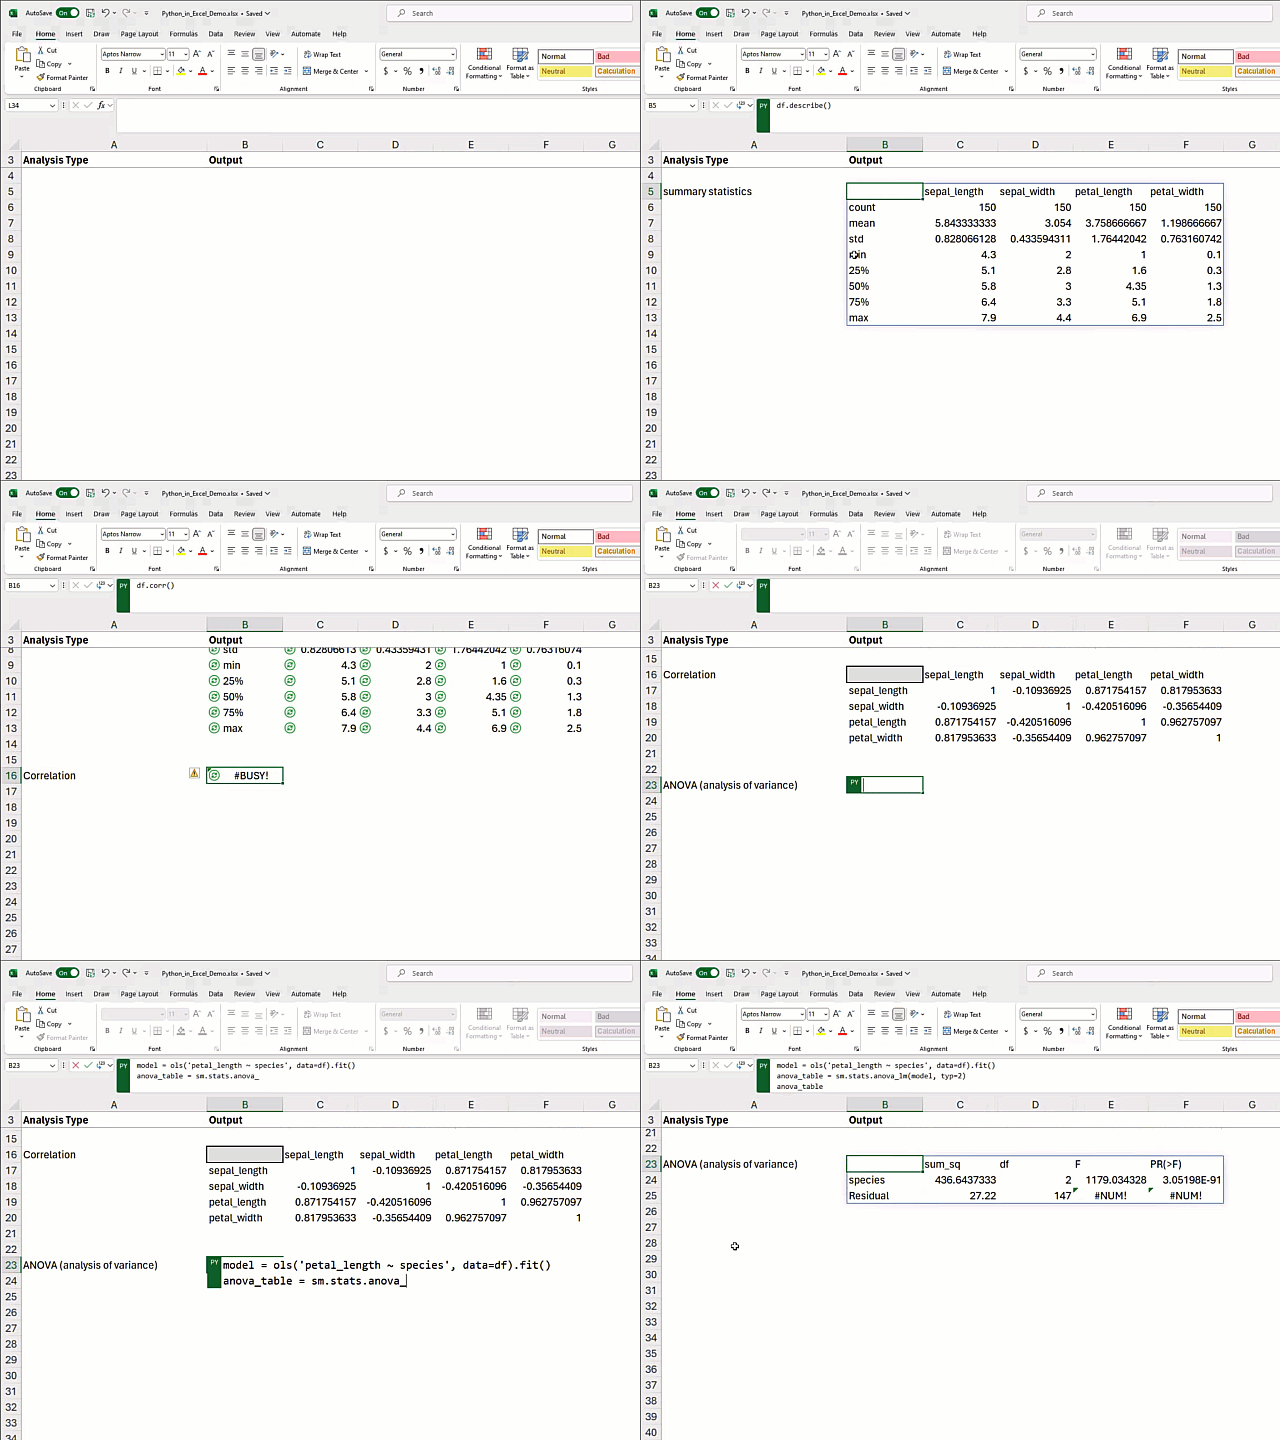
For Excel users, this opens a new world of data analysis potential previously limited to data scientists and developers. Within your familiar spreadsheet environment, you can now harness Python’s power to perform complex statistical analyses with popular packages such as pandas and statsmodels and create sophisticated visualizations using Matplotlib and Seaborn. Python practitioners can now marry scripts and rich visualizations with the widespread accessibility of Excel, enabling an uninterrupted workflow and making your work easier to share with colleagues who primarily use Excel.
The integration of the Anaconda Distribution for Python in Microsoft Excel is more than a feature; it’s a redefinition of what’s possible within data analytics. It combines Python’s advanced capabilities with Excel’s familiar interface, bridging the gap between high-powered data science and everyday business tools. The future of data analytics has arrived, and it’s more integrated, more powerful, and more accessible than ever. In this post, we’ll share how Python in Excel works, what you can do with it, and how to get started.
All You Need Is =PY()
Using Python in Excel is as simple as typing “=PY(” in your Excel cell, followed by your Python code. The results of your Python calculations or visualizations will then appear in your Excel worksheet.
For instance, you can use Python code to easily join two complex datasets, right within Excel.

Broadening Horizons with Python in Excel
With Python in Excel, you open a gateway to new possibilities in your data analysis workflows. Let’s explore some of the powerful transformations you can bring to your everyday workflow:
Create Advanced Data Visualizations
Leverage robust Python visualization libraries, such as Matplotlib and Seaborn, right in your Excel workbook for comprehensive data representation.

Accomplish Deep Statistical Analysis
Elevate your analysis using Python’s powerful libraries such as pandas and statsmodels. Accomplish comprehensive statistical tasks directly within your Excel cells. You don’t need to be a data science expert—Anaconda’s curated Python libraries embedded in Excel make advanced analytics accessible to everyone.

Share Your Work
Maintain the complexity and power of your Python analyses, while presenting them in an Excel-friendly format. Sharing and collaborating with colleagues who use Excel is simple and straightforward.

Access Powerful Python Libraries
This feature doesn’t just bring Python into Excel; it brings the rich ecosystem of Python libraries as well. Libraries like pandas for data manipulation, statsmodels for advanced statistical modeling, and Matplotlib and Seaborn for data visualization are all available in Excel, unlocking a universe of new possibilities for your spreadsheets.

Getting Started
Experience the power of Python in Excel for yourself. Windows users can sign up here to try Python in Excel today. Support for Mac users will be available at a future date. Learn more about Python in Excel here, and sign up for this Anaconda certification: Data Analysis with Python in Excel. We’re excited to see what innovative solutions you’ll create with Python in Excel.
