Anaconda Platform
7.0.0 is available through a limited early access program. Contact your Anaconda Technical Account Manager (TAM) if you’re interested in adopting the latest version.Enabling and managing the monitoring stack
System monitoring is generally enabled during installation, but can be configured at any time.- Log in to the admin console.
- Click the Config tab.
-
Under Observability, select or clear checkboxes to manage your monitoring stack:
- Enable Monitoring Stack: Enable or disable the use of the platform’s monitoring software.
- Enable Perses for Visualization: Enable Perses dashboards for visualizing metrics from the monitoring stack.
- Expose Prometheus & Alertmanager Ports Externally: Select this checkbox to display the subsequent checkboxes.
- Expose Prometheus on Port 9090: Exposes Prometheus externally on port 9090.
- Expose Alertmanager on Port 9093: Exposes Prometheus externally on port 9093.
Exposing Prometheus & Alertmanager externally enables you to connect your own visualization tools to the monitoring stack. - Scroll to the bottom and click Save config.
- Click the Dashboard tab and redeploy your instance to apply your changes.
Accessing Perses to monitor system metrics
To access the Perses dashboards, open a browser and navigate tohttps://<FQDN>:8888.
Example
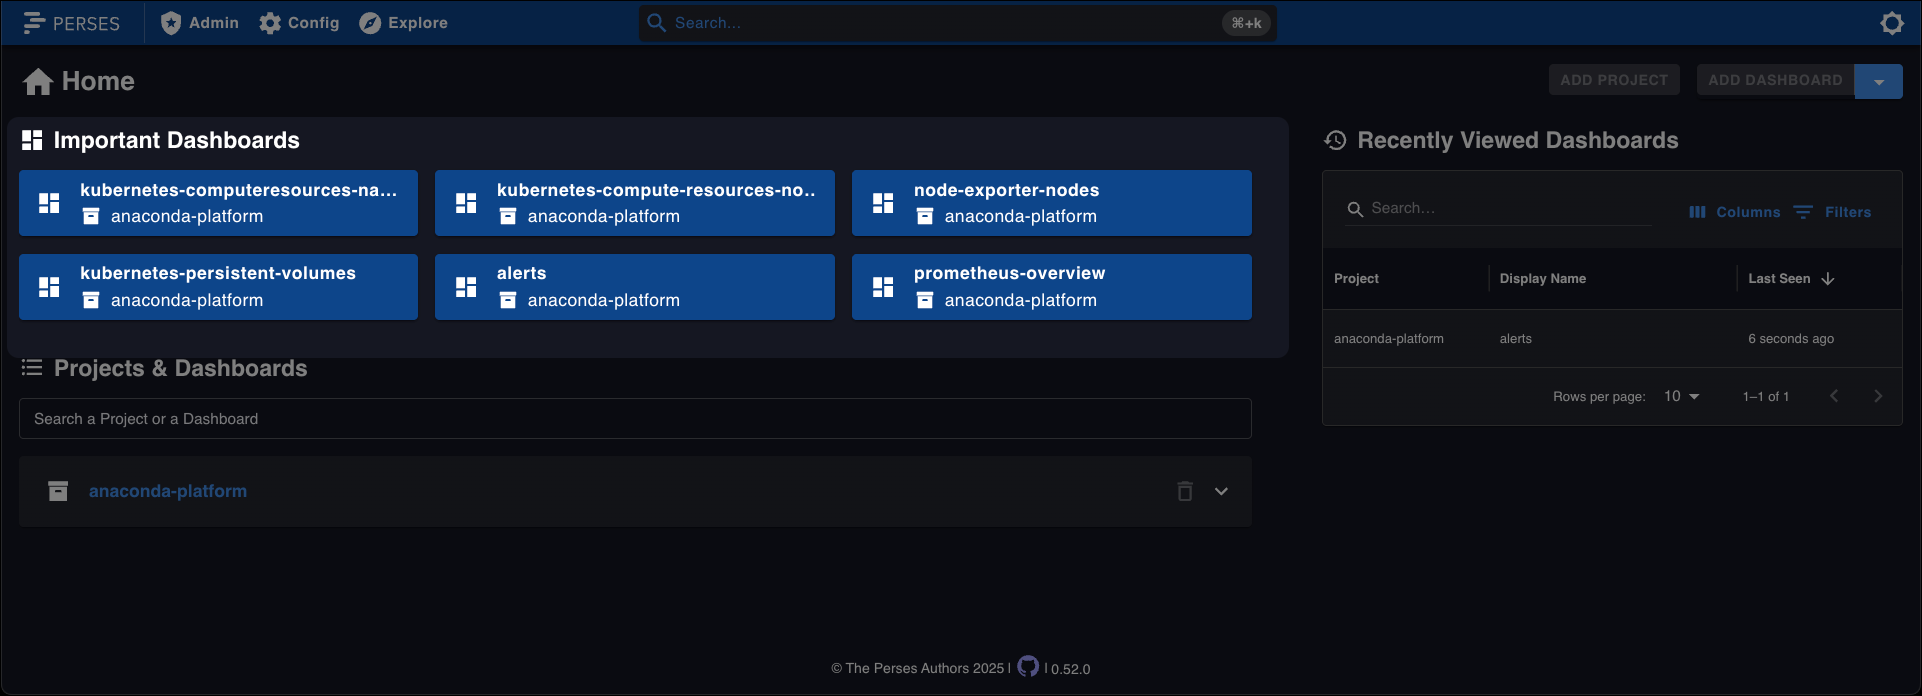
Viewing dashboards
Anaconda Platform includes a number of important dashboards that contain helpful information for you to monitor the health of your system. Select a dashboard to view the metrics associated with that dashboard.