From Notebook to Workbook: Power Up Your Data Science Skills with Python in Excel

Valerio Maggio

The most common way to create effective data reports with Excel and Python normally requires loading the data into a Jupyter notebook (e.g. using pandas) and converting the notebook itself into a report to share with stakeholders. But what if we didn’t need to work in external Jupyter notebooks anymore, and instead could work with Python directly in our Excel workbooks?

In this post, we will explore how Python in Excel empowers Excel users to work with Python and Anaconda Distribution directly within the Excel spreadsheets.

Note: To reproduce the examples in this post, install the Python in Excel trial

Introduction

Data reports are essential to communicating insights with stakeholders. Microsoft Excel is a powerful tool that enables users to manipulate and visualize even large amounts of data. Thanks to a wide range of built-in features such as pivot tables, data tables, and various statistical functions, Excel is widely used in many sectors—e.g., finance, accounting, and sales—to generate effective data reports quickly and easily. However, working with data is never a “straight line,” as we must preprocess (e.g. clean, filter, group, transform) our original datasets in order to extract meaningful insights. Where we would typically migrate the  entire workload to Python code (with its rich ecosystem of libraries and tools for data science), we can now use Python and its powerful libraries (such as pandas) without needing to leave Excel.

Integrated directly into Excel, Python enhances workbooks with a multitude of packages for scientific computing and data science (e.g. NumPy, pandas, SciPy, Matplotlib, scikit-learn).

In this blog post, I’ll  demonstrate how to use the new Python capabilities in Excel workbooks for effective data reporting. 

From Jupyter Notebook to Excel Workbook

The major innovation in Excel is the new =PY cell that immediately enables Python in the workbook. You can create a new Python cell in an Excel workbook by selecting a cell and typing “=PY” or using the keyboard shortcut:

Ctrl+Shift+Alt+P

To emphasize that we are working in a new Python cell, the left borders of both the cell and its editor will immediately turn dark green (see below).

As you can see, the extension also integrates into the Formulas pane to quickly create a new cell or review an existing one. 

Note: Currently, Python in Excel functionality is exclusive to Windows users. Support will be extended to Mac users in the future; stay tuned for updates.

How does it work?

The first thing to clarify is that you do not need to have Python already installed on your computer to be able to run Python in your Excel workbook. All of the execution happens automatically in a sandboxed environment on Microsoft Azure. Therefore, a working internet connection is necessary. Because of the sandbox execution environment, no access to the internet nor the local file system is permitted to the Python code running in the cells. Therefore, none of the below Python code to read in data will work:

Python
requests.get("https://url_to_my_fantastic_dataset")
# OR
pd.read_csv("C:\\Users\\Valerio\\Downloads\\my_fantastic_dataset.csv")
# OR
sklearn.dataset.fetch_california_housing()  # requires internet to download the data

The new Python in Excel extension is fully powered by Anaconda: Anaconda Distribution is automatically used in the backend, and therefore there is no need to worry about the environment as all the major packages for data science and machine learning are already available in Excel: NumPy, SciPy, Matplotlib, Seaborn, statsmodels, and scikit-learn, just to mention some of the most popular ones as well as some that we will be using in the working example in the next section. 

Spreadsheets Versus Notebooks

The last things to bear in mind when transitioning from external Jupyter notebooks to Excel workbooks are the similarities and the differences between the two formats, as they have direct impacts on how to organize code and how the code will be executed. 

Both notebooks and spreadsheets are cell-oriented formats; the content is organized into multiple consecutive cells. However, while the spreadsheet model is two-dimensional (i.e. rows and columns), the notebooks simply unravel in one dimension (i.e. one single column). 

Excel workbooks can be composed of one or more spreadsheets—therefore the underlying data model is indeed three-dimensional (3D) (spreadsheet, row, column). The execution of the Python code in Excel will follow the same 3D model, starting from the top-left cell of the first spreadsheet and continuing in a row-major fashion.

Please keep this model in mind when writing your Python code in Excel. If, say, you are importing a package in a Python cell located in C10, since all the cells share a global namespace—similar to Jupyter Notebook cells—this package will also be available in any other Python cells located from C11 onwards (in the current spreadsheet), as well as any other spreadsheets afterwards. However, this package will not be available in B1, one row prior to where it is imported.

Despite these differences in the underlying data model, the development best practices when writing Python code into cells of Excel workbooks is the same as with the cells of Jupyter notebooks: Opt for code snippets over longer code listings that are difficult to read and maintain.

The big difference when writing Python in workbooks rather than Jupyter notebooks is that the Python code contained in cells is automatically “hidden,” and the content of each cell is automatically replaced by any return value the code produces. If the code has no direct return value, “None” will be displayed by default as cell content instead. 

Don’t worry if this is not yet clear. We will dive deeper into cell outputs with an example in a moment.

Example: Analyzing Financial Data with Python in Excel

Let’s now explore a concrete example of how effectively Python in Excel works and can be applied.

You can directly download this Financial Sample Excel Workbook. Once downloaded and opened in Excel, the first thing we will do is rename the Sheet1 spreadsheet to “Financial_Data,” and then we’ll add a new spreadsheet named “Report.” 

Giving spreadsheets meaningful names is generally a good practice, and will also make ours easier to refer to later in this section. 

In the new “Report” spreadsheet, let’s add our first lines of Python by writing in the top-left cell (A1) the following code:

Python
import pandas as pd

# This will be automatically converted into a pandas.DataFrame
df = xl("'Financial_Data'!A1:P701", headers=True)
# Make sure that the date column is interpreted as datetime
df["Date"] = pd.to_datetime(df["Date"])
# return value of the cell
df

Use Ctrl+Enter to commit the Python code and trigger its execution. 

Once executed, this will generate a pandas.DataFrame representation of our data into the workbook. Thanks to the new xl() function we are able to select a RANGE of Excel cells which are automatically converted into pandas.DataFrame when ported in the Python runtime environment. 

Let’s make things more interesting now. Instead of replicating all of the data, let’s leverage the filtering and grouping capabilities of pandas to generate an aggregated version of this data. 

Let’s go back now to the same A1 cell, and modify the content with the following code: 

Python
import pandas as pd

# This will be automatically converted into a pandas.DataFrame
df = xl("Financial_Data!A1:P701", headers=True)
# Make sure that the date column is interpreted as datetime
df["Date"] = pd.to_datetime(df["Date"])

# Aggregate by 'Country' and 'Segment' and then sum all the values in the 'Sales' column
country_segments = df.groupby(["Country", "Segment"], as_index=False)
                    .agg({"Sales": "sum"})

# return value of the cell (grouped data)
country_segments

If we try to run this code, we get an error! ⚠️

This is a wonderful opportunity to appreciate how things look when code errors occur in our Python code. 

What is going on?

Apparently pandas was not able to find a column labeled Sales in the df data frame. This is because the original column names, i.e. the headers, contain spaces:  “  Sales  ” rather than “Sales”). Therefore, we should strip out this formatting from column names in order to reference them programmatically! Remember? Working with data is never a “straight line!”

Let’s rewrite our code snippet by adding a workaround to fix column names:

Python
import pandas as pd

# This will be automatically converted into a pandas.DataFrame
df = xl("Financial_Data!A1:P701", headers=True)
# Make sure that the date column is interpreted as datetime
df["Date"] = pd.to_datetime(df["Date"])

# Fix column names by stripping white space
df.columns = [col.strip() for col in df.columns]

# groupby
country_segments = df.groupby(["Country", "Segment"], as_index=False)
                    .agg({"Sales": "sum"})

# return value of the cell
country_segments

To commit and run the code hit Ctrl+Enter in the cell. You should obtain the following result (see figure below):

After generating the output, I’ve marked in bold the resulting headers, i.e., Sales, Country, and Segment, for readability. In fact, it is always possible to change the formats of the cells in a spreadsheet to improve readability. Similarly, we could set the format of cells in the newly generated Sales column to Currency:

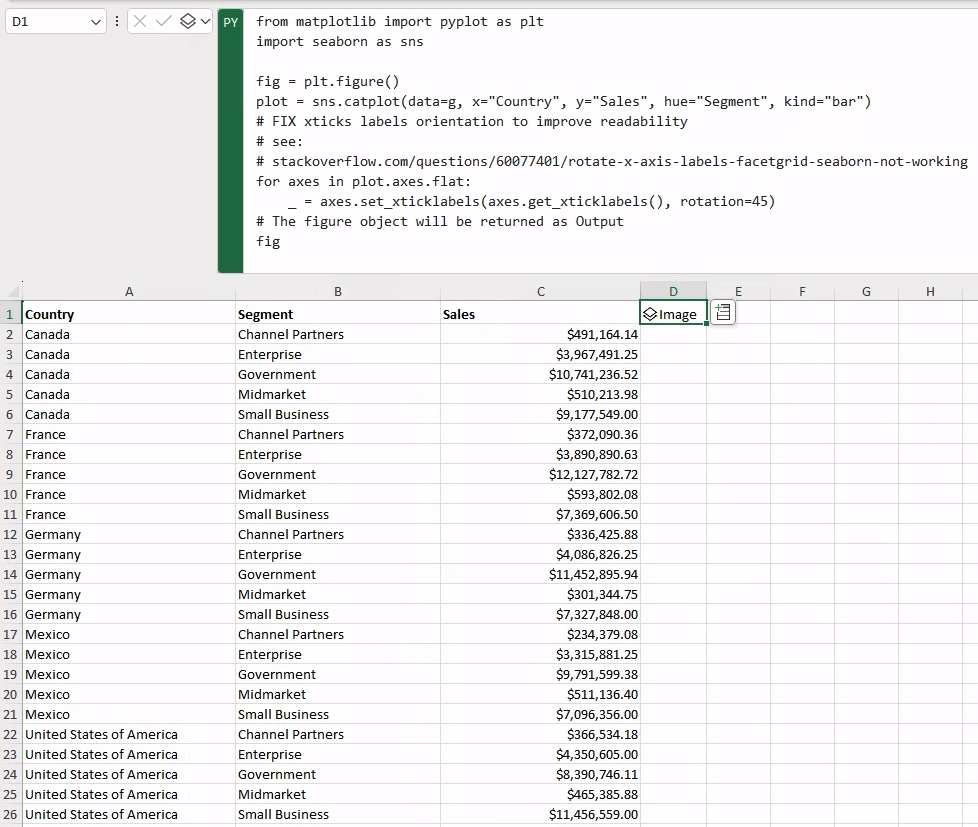
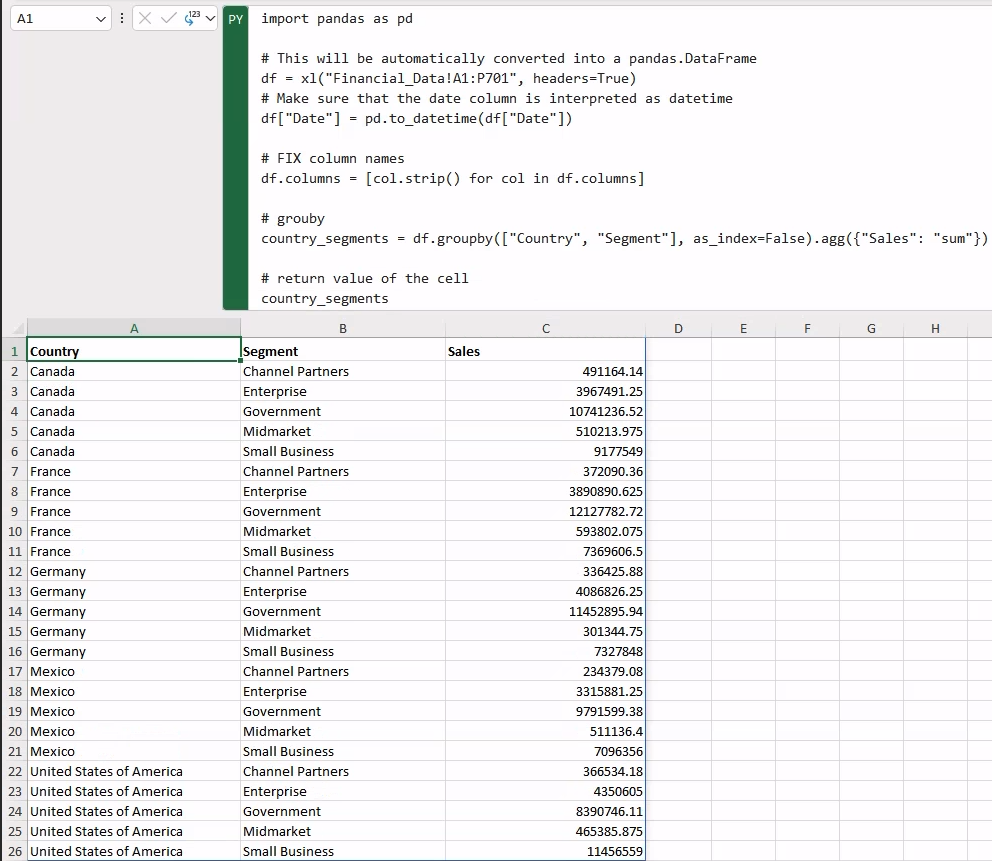
Now that we have our aggregated data, let’s generate a plot of the aggregated sales using Seaborn. Specifically, we will be generating a catplot as our aggregation axes are categorical (namely Country and Segment).

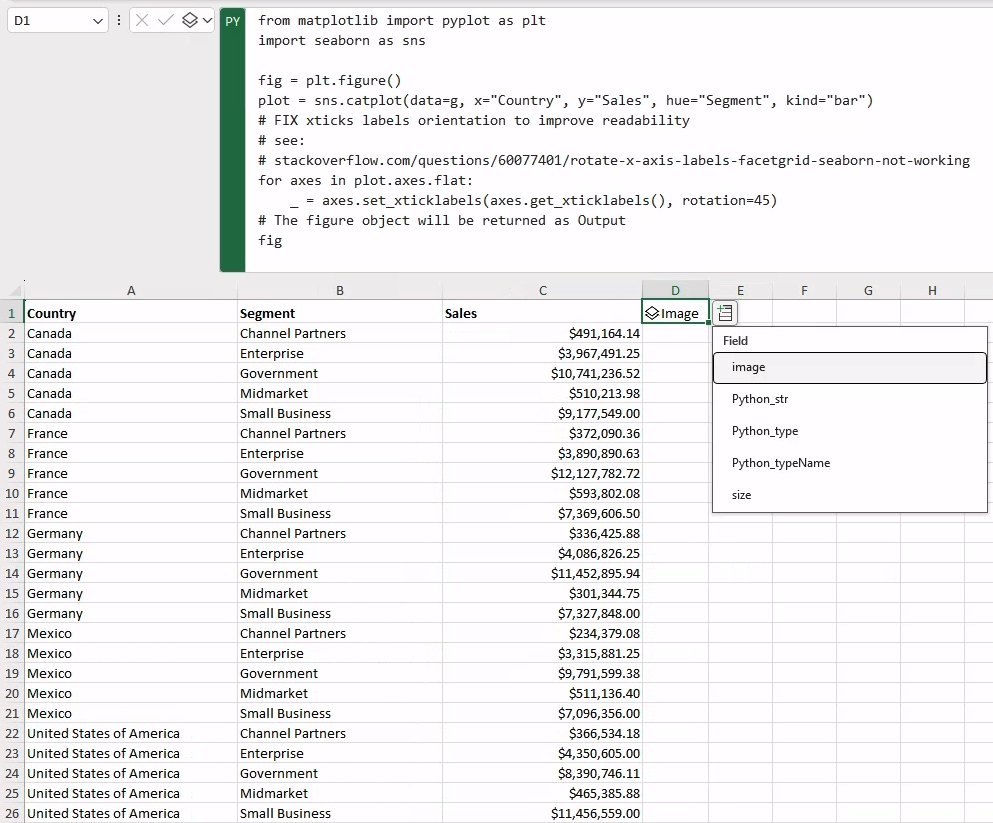
Let’s move onto the cell D1 and type in =PY. However, this time let’s mark its output as a Python object by clicking on the drop-down menu next to the left side of the cell. 

The default output of a Python cell is set as “Excel value,” which is marked in the dropdown menu with this icon: . When we set the output of the cell as “Python object,” the icon in the menu becomes this one instead: .

When it comes to displaying images in cells, the default “Excel value” output will display the image directly within a cell. However, if we decide to detach the image from the cell, all the (Python) code used to generate the image will be lost. 

This is generally not an issue, but for the sake of this post we want to keep the Python code in the cell and visualize the resulting plot. So, setting up the output of a cell as a Python object is a more flexible solution.

Let’s now add the following Python code to the newly created Python cell in D1:

Python
from matplotlib import pyplot as plt
import seaborn as sns

fig = plt.figure()
plot = sns.catplot(data=country_segments, x="Country", y="Sales", hue="Segment", kind="bar")
# FIX xticks labels orientation to improve readability
for axes in plot.axes.flat:
    _ = axes.set_xticklabels(axes.get_xticklabels(), rotation=45)
# The figure object will be returned as Output
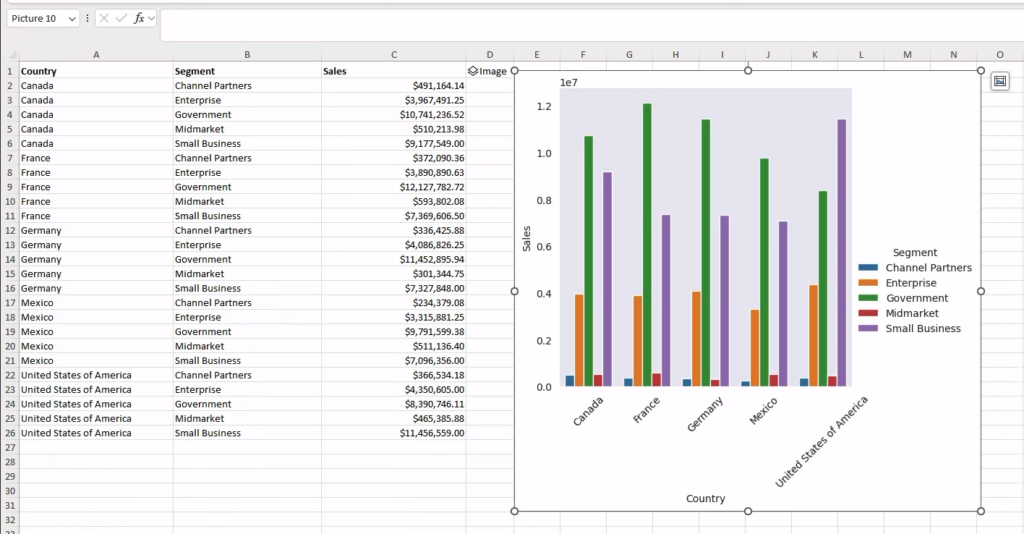
fig  

When we commit and run the code, this is what you should see in your workbook:

With this integration, Excel now has built-in support for Python objects displayed in workbook cells. The Image object shown in the D1 cell in the figure holds direct reference to the underlying Python object.

Finally, to visualize the generated plot, we can either select the Image from the context menu (as shown in the figure below) or type the following instruction in the E1 cell:

=D1.Image

This will display the generated categorical plot that can then be placed over cells for further customizations.

Conclusion

In this blog post, we explored how a new integration enables Excel users to leverage Python directly inside Excel workbooks without having to move analysis into Jupyter notebooks. Python in Excel is powered by Anaconda Distribution, which offers immediate access to a rich ecosystem of Python packages for data science and machine learning. This extension is currently only available for Windows users, and it is still in the Beta phase. Therefore, bugs may occur and things may still change and improve. Nonetheless, the potential that this technology unlocks is indeed unprecedented, presenting a completely new way to perform data analysis in Excel.

You can view the workbook developed in this blog post via this link

Disclaimer: The Python integration in Microsoft Excel is in Beta Testing as of the publication of this article. Features and functions are likely to change. Don’t hesitate to reach out if you notice an error on this page. 

Bio

Valerio Maggio is a researcher and data scientist advocate at Anaconda. He is also an open-source contributor and an active member of the Python community. Over the last 12 years he has contributed to and volunteered at many international conferences and community meetups like PyCon Italy, PyData, EuroPython, and EuroSciPy.

Talk to an Expert

Talk to one of our financial services and banking industry experts to find solutions for your AI journey.

Talk to an Expert