Home Capability Visualization
Visualization
Efficiently explore, analyze, and communicate complex data for informed decision-making.
Derive Insights From Intricate Datasets
Anaconda’s data science solutions encompass comprehensive visualization libraries, Jupyter Notebooks integration, dashboarding solutions, and scalability and performance optimizations.
Uncover Business Insights
Visualization facilitates the discovery of patterns, trends, and outliers within data, thereby enhancing insight generation beyond what is achievable through raw data or numerical summaries.
Communicate to Stakeholders
Visualizations offer an intuitive and accessible medium for communicating findings and insights to stakeholders, thereby fostering better understanding and informed decision-making.
Exploration
Interactive visualizations empower users to dynamically explore data, facilitating in-depth analysis from diverse perspectives.
Support Effective Decision-Making
Visualizations aid decision-making by presenting data in a clear, concise, and actionable format, thereby reducing cognitive load and enhancing decision-making efficiency.
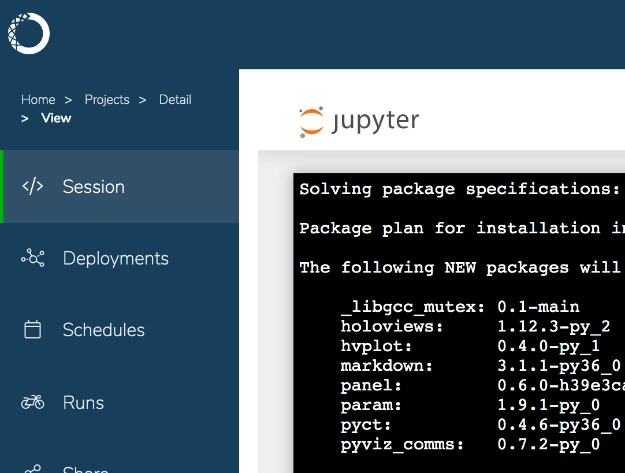
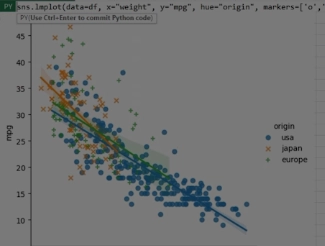
Anaconda Notebooks
Additional Resources

Why Data Visualization is One of the Hardest but Most Important Tasks
Introduction to Data Visualization with Python in Excel