Training for the Boston Marathon requires consistency, commitment, and a way to track progress over time. Imagine having a custom-built habit tracker that not only keeps you on pace but also helps visualize your progress—all powered by Python!
Today, we’ll walk through how to build a complete habit-tracking web app using Python, from start to finish. No need for JavaScript—this is a full-stack Python project designed to help you stay on track with your marathon milestones.
We’ll be leveraging the recently released panel-full-calendar, which is an extension of Panel. (You can wrap any Javascript libraries into Python with your own Panel extensions with: copier-template-panel-extension!)
Let’s get started with two straightforward lines:
from panel_full_calendar import Calendar
Calendar().show()
We can see a Calendar launch in our browser:
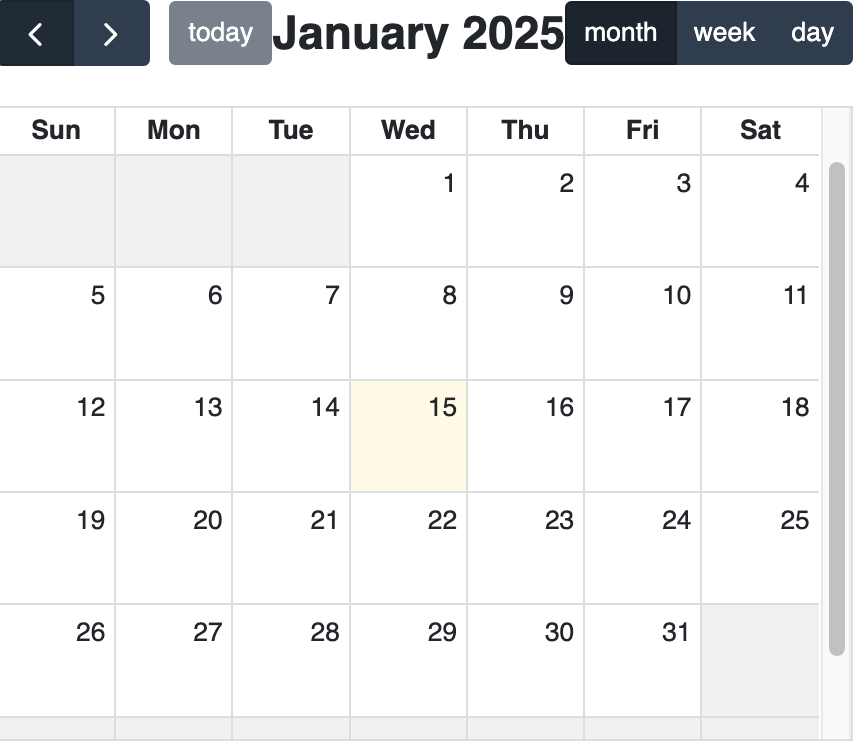
It’s a little crowded, so let’s set the sizing_mode to stretch to the whole screen:
from panel_full_calendar import Calendar
Calendar(sizing_mode="stretch_both").show()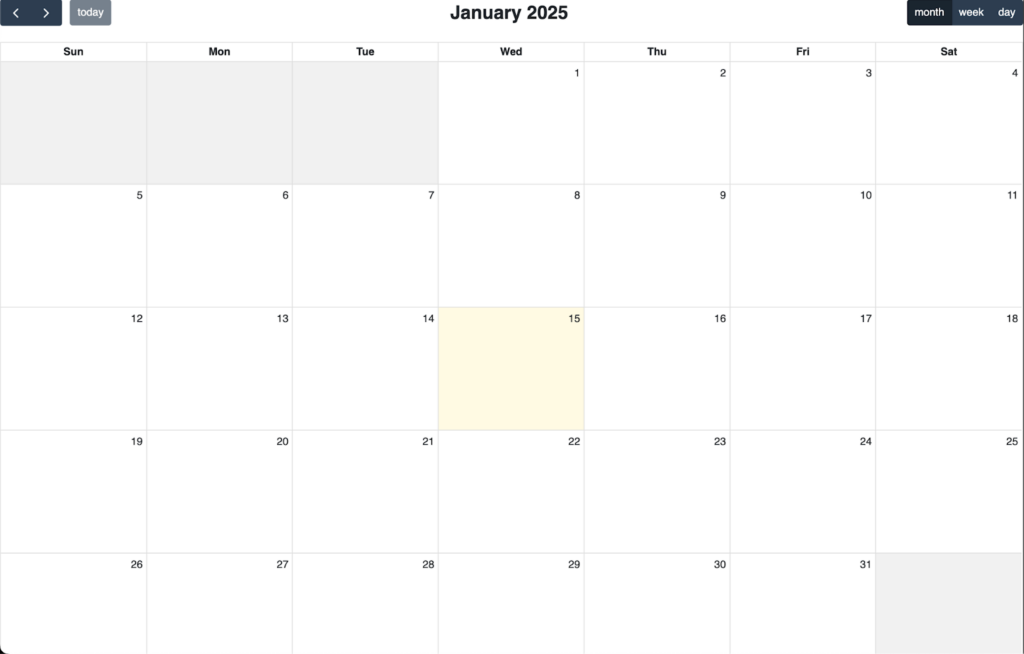
Much better! In the upcoming app, we won’t need to view the week or day, so let’s also update the header_toolbar. Since we will need more imports later, let’s just do that now too.
import sqlite3
import datetime
import panel as pn
import pandas as pd
from panel_full_calendar import Calendar, CalendarEvent
calendar = Calendar(
    sizing_mode="stretch_both",
    header_toolbar={
        "left": "today",
        "center": "title",
        "right": "prev,next",
    },
)
calendar.show()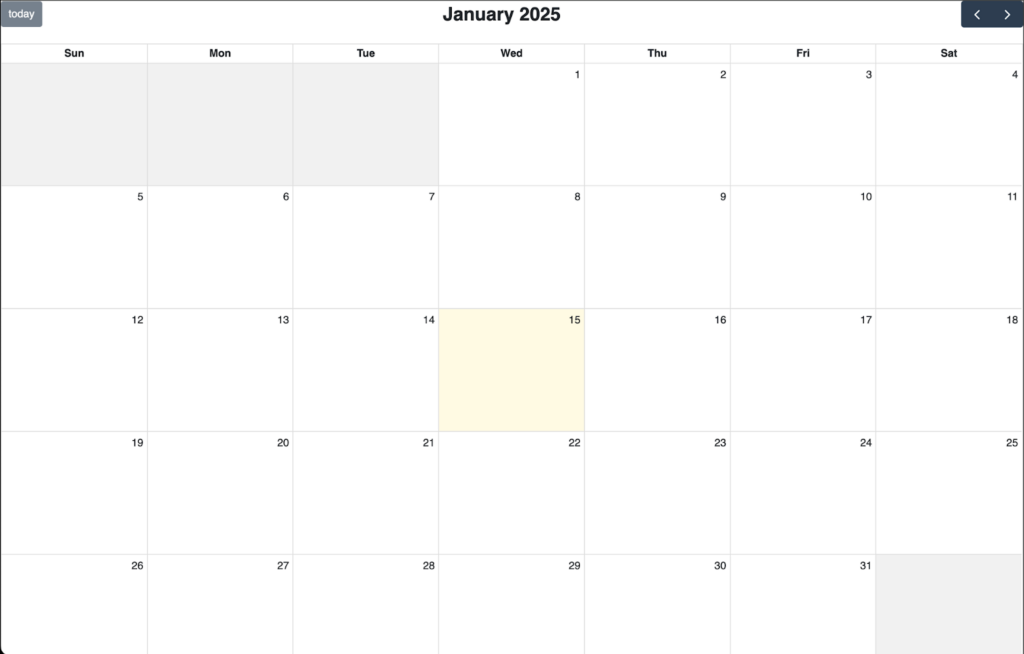
A calendar without events isn’t so useful. So let’s add some!
First, “Happy New Year!” You can pass date strings directly into add_event
new_years_str = "2025-01-01"
calendar.add_event(new_years_str, title="🎉 Happy New Year!")
Alternatively, you can also pass in a datetime object. Let’s set the date of the theoretical marathon we’re training for:
marathon_dt = datetime.datetime(2025, 4, 21)
calendar.add_event(marathon_dt, title="🏃 Boston Marathon", color="red")
Finally, for every day until the marathon, let’s add a training event.
events = [
    dict(start=date, title="❌ Train")
    for date in pd.date_range(new_years_str, marathon_dt, freq="D")
]
calendar.add_events(events)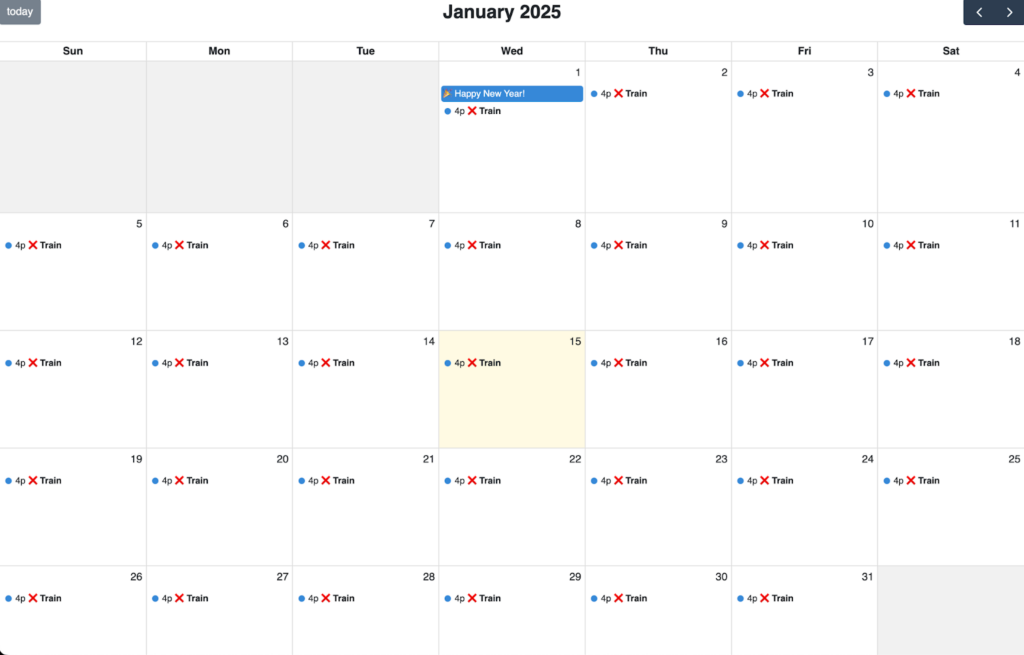
Great! We’re getting somewhere, but it’s a little unexciting, so let’s add some interactive toggling.
Here, when we click on an event, the ❌ turns into ✅ and vice versa, so when the entire month is done, we can see all the hard work we’ve put in!
today = pd.to_datetime(datetime.datetime.now())
def toggle_action(event_dict):
    event = CalendarEvent.from_dict(event_dict, calendar)
    if pd.to_datetime(event.start).date() > today.date():
        # do not let users click beyond the current date
        return
    if "❌" in event.title:
        title = event.title.replace("❌", "✅")
    else:
        title = event.title.replace("✅", "❌")
    event.set_props(title=title)
calendar.event_click_callback = toggle_action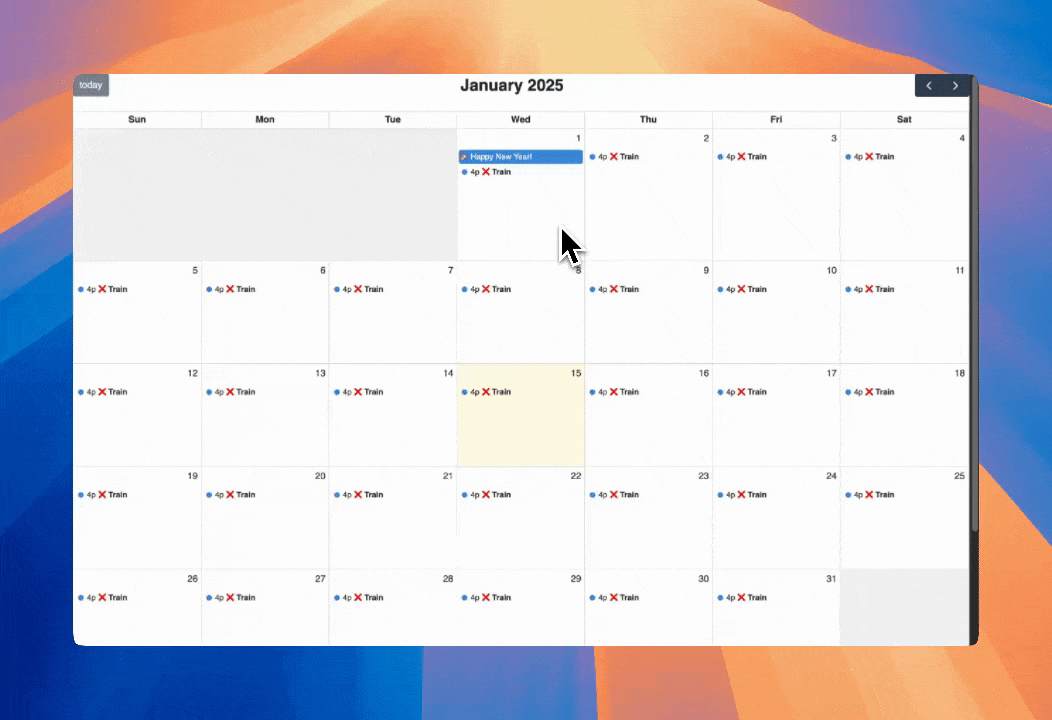
Cool! What if we wanted to see our stats, like days until Marathon, or how many days we committed to our streak?
Easy! Start by initializing some indicators (don’t be afraid of the length; lots of it is repeat keyword arguments).
progress = pn.indicators.Progress(
    value=0,
    active=False,
    max=len(events) - 2,
    sizing_mode="stretch_width",
    align="center",
)
goals_completed = pn.indicators.Number(
    value=0,
    name="Complete",
    colors=[(0, "red"), (50, "gold"), (100, "green")],
    font_size="36px",
    title_size="18px",
    align="center",
)
goals_missed = pn.indicators.Number(
    value=0,
    name="Miss",
    colors=[(0, "green"), (30, "red")],
    title_size="18px",
    font_size="36px",
    align="center",
)
completion_rate = pn.indicators.Number(
    value=0,
    name="Rate",
    format="{value}%",
    colors=[(0, "red"), (50, "gold"), (100, "green")],
    title_size="18px",
    font_size="36px",
    align="center",
)
days_streak = pn.indicators.Number(
    value=0,
    name="Streak",
    colors=[(0, "red"), (30, "gold"), (60, "green")],
    title_size="18px",
    font_size="36px",
    align="center",
)
days_left = pn.indicators.Number(
    value=0,
    name="Days left",
    colors=[(0, "red"), (60, "gold"), (120, "green")],
    title_size="18px",
    font_size="36px",
    align="center",
)
indicators = pn.Column(
    pn.pane.HTML("<h2>🚀 Progress Tracker</h2>"),
    progress,
    pn.layout.Divider(),
    pn.Row(goals_completed, goals_missed, completion_rate, align="center"),
    pn.layout.Divider(),
    pn.Row(days_streak, days_left, align="center"),
    height=500,
)
We can put these in the sidebar, with the calendar in the main. We can also give it a title, use a dark theme, and set custom colors:
pn.template.FastListTemplate(
    sidebar=[indicators],
    main=[calendar],
    title="📅 Marathon Training Calendar",
    accent_base_color="#D3D3D3",
    header_background="#36454F",
    theme="dark",
    sidebar_width=250,
).show()
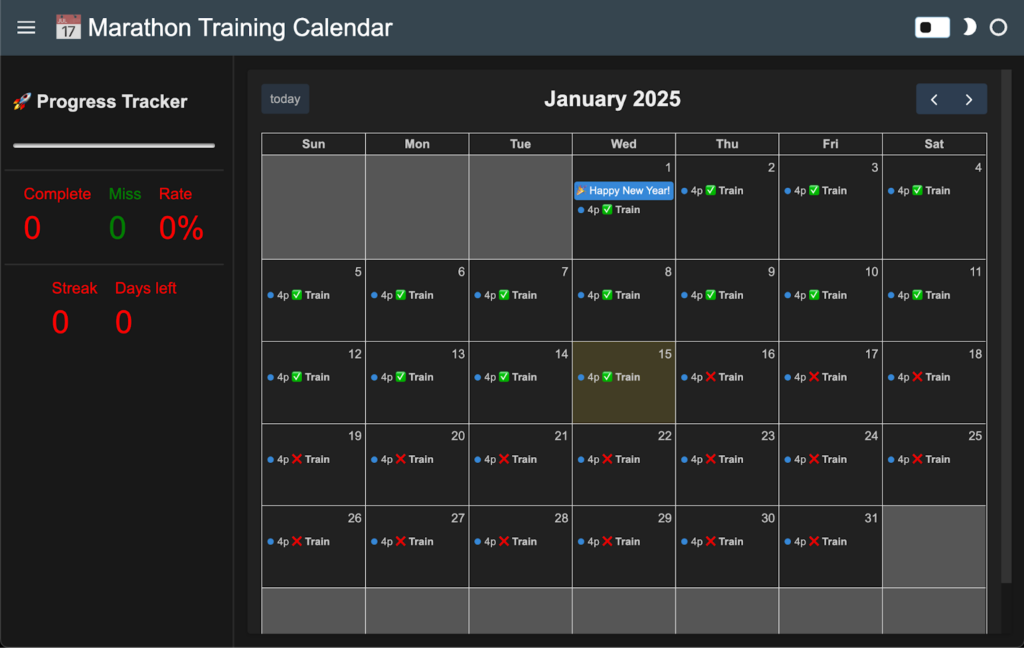
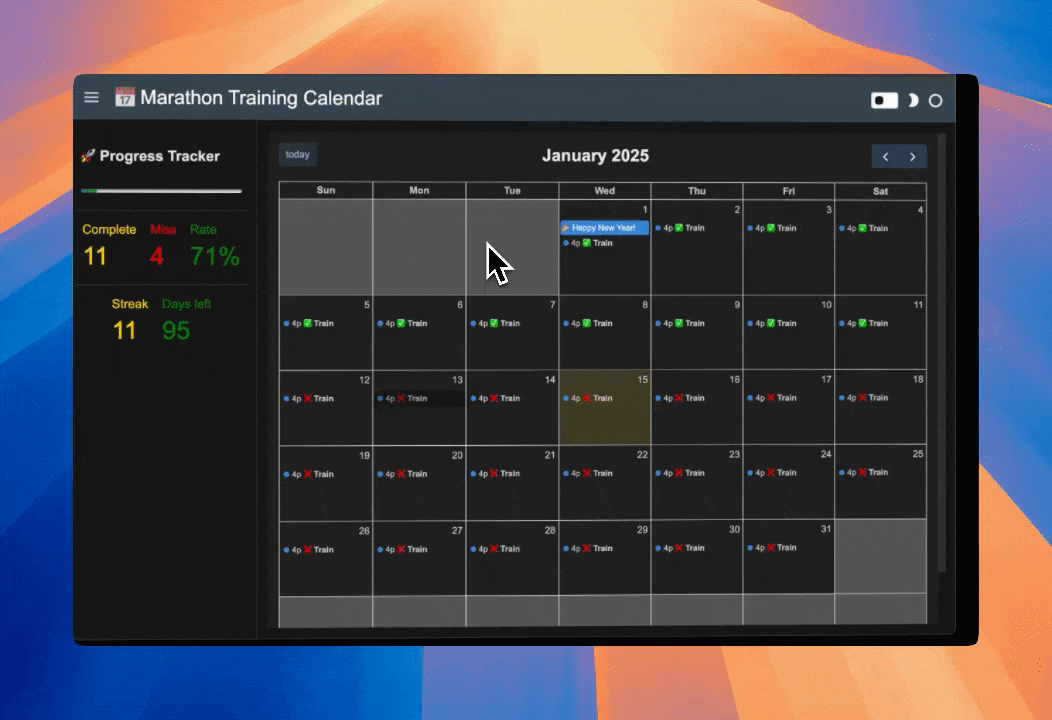
It’s looking good, but the indicators are all 0… Let’s fix that with some calculation function:
async def update_indicators(value):
    total_days = (marathon_dt - today).days
    days_from_start = (today.date() - pd.to_datetime(new_years_str).date()).days
    # Set days_left based on total_days
    days_left.value = total_days
    completed_goals = 0
    missed_goals = 0
    current_streak = 0
    max_streak = 0
    last_date = None
    # Sort events by date to ensure chronological processing
    sorted_events = sorted(value, key=lambda x: pd.to_datetime(x["start"]).date())
    # Single loop to calculate both completed and missed goals
    for event in sorted_events:
        title = event["title"]
        if not ("✅" in title or "❌" in title):
            continue
        start = pd.to_datetime(event["start"]).date()
        # Skip future dates
        if start > today.date():
            break
        # Check for date continuity in streak
        if last_date is not None:
            days_difference = (start - last_date).days
            if days_difference > 1:  # Break in streak
                max_streak = max(max_streak, current_streak)
                current_streak =
        if "✅" in title:
            completed_goals += 1
            current_streak += 1
            last_date = start
        elif "❌" in title:
            missed_goals += 1
            max_streak = max(max_streak, current_streak)
            current_streak = 0
            last_date = start
    # Handle final streak
    max_streak = max(max_streak, current_streak)
    # Calculate goals met percentage if days_from_start is positive
    completion_rate.value = round(
        (max(completed_goals - 1, 0) / days_from_start * 100)
        if days_from_start > 0
        else 0
    )
    # Set current streak (use max_streak for the longest streak achieved)
    days_streak.value = max_streak
    # Set goals completed
    goals_completed.value = completed_goals
    # Set goals missed (removed the -1 as it was artificially reducing missed goals)
    goals_missed.value = max(missed_goals - 1, 0)
    # Update progress bar
    progress.value = completed_goals
Now that we have a function to call, we just need to bind it to the calendar’s value:
Here, we watch when the calendar’s value changes to trigger update_indicators; we also trigger the calendar’s value once to initialize the value.
pn.bind(update_indicators, value=calendar.param.value, watch=True)
calendar.param.trigger("value")
And voila: an interactive habit tracker calendar! 🎉
But we’re not quite done. If you stop now, the server would not save your progress! To make this project full stack, we need a database. Here we’ll use SQLite because it’s lightweight and perfect for a single user.
When calendar events are set, for convenience, we’ll create a dataframe from those events, and export it to an events table in the calendar.db.
def store_events(value: list):
with sqlite3.connect("calendar.db") as conn:
        df = pd.DataFrame(value)
        df["start"] = df["start"].astype(str)
        df.to_sql("events", conn, if_exists="replace", index=False)
pn.bind(store_events, value=calendar.param.value, watch=True)
And, when we re-launch the server, we can read from that database to re-initialize the calendar with those same events!
with sqlite3.connect("calendar.db") as conn:
df = pd.read_sql("SELECT * FROM events", conn)
    if not df.empty:
        calendar.value = df.to_dict(orient="records")
Refactoring the code, we have this full script:
import datetime
import panel as pn
import pandas as pd
import sqlite3
from panel_full_calendar import Calendar, CalendarEvent
# Define callbacks
def store_events(value: list):
    if not value:
        return
    with sqlite3.connect("events.db") as conn:
        df = pd.DataFrame(value)
        df["start"] = df["start"].astype(str)
        df.to_sql("events", conn, if_exists="replace", index=False)
def toggle_action(event_dict: dict):
    event = CalendarEvent.from_dict(event_dict, calendar)
    if pd.to_datetime(event.start).date() > today.date():
        return
    if "❌" in event.title:
        title = event.title.replace("❌", "✅")
    else:
        title = event.title.replace("✅", "❌")
    event.set_props(title=title)
async def update_indicators(value: list):
    total_days = (marathon_dt - today).days
    days_from_start = (today.date() - pd.to_datetime(new_years_str).date()).days
    # Set days_left based on total_days
    days_left.value = total_days
    completed_goals = 0
    missed_goals = 0
    current_streak = 0
    max_streak = 0
    last_date = None
    # Sort events by date to ensure chronological processing
    sorted_events = sorted(value, key=lambda x: pd.to_datetime(x["start"]).date())
    # Single loop to calculate both completed and missed goals
    for event in sorted_events:
        title = event["title"]
        if not ("✅" in title or "❌" in title):
            continue
        start = pd.to_datetime(event["start"]).date()
        # Skip future dates
        if start > today.date():
            break
        # Check for date continuity in streak
        if last_date is not None:
            days_difference = (start - last_date).days
            if days_difference > 1:  # Break in streak
                max_streak = max(max_streak, current_streak)
                current_streak = 0
        if "✅" in title:
            completed_goals += 1
            current_streak += 1
            last_date = start
        elif "❌" in title:
            missed_goals += 1
            max_streak = max(max_streak, current_streak)
            current_streak = 0
            last_date = start
    # Handle final streak
    max_streak = max(max_streak, current_streak)
    # Calculate goals met percentage if days_from_start is positive
    completion_rate.value = round(
        (max(completed_goals - 1, 0) / days_from_start * 100)
        if days_from_start > 0
        else 0
    )
    # Set current streak (use max_streak for the longest streak achieved)
    days_streak.value = max_streak
    # Set goals completed
    goals_completed.value = completed_goals
    # Set goals missed (removed the -1 as it was artificially reducing missed goals)
    goals_missed.value = max(missed_goals - 1, 0)
    # Update progress bar
    progress.value = completed_goals
# Define calendar and indicators
calendar = Calendar(
    sizing_mode="stretch_both",
    header_toolbar={
        "left": "today",
        "center": "title",
        "right": "prev,next",
    },
)
progress = pn.indicators.Progress(
    value=0,
    active=False,
    sizing_mode="stretch_width",
    align="center",
)
goals_completed = pn.indicators.Number(
    value=0,
    name="Complete",
    colors=[(0, "red"), (50, "gold"), (100, "green")],
    font_size="36px",
    title_size="18px",
    align="center",
)
goals_missed = pn.indicators.Number(
    value=0,
    name="Miss",
    colors=[(0, "green"), (30, "red")],
    title_size="18px",
    font_size="36px",
    align="center",
)
completion_rate = pn.indicators.Number(
    value=0,
    name="Rate",
    format="{value}%",
    colors=[(0, "red"), (50, "gold"), (100, "green")],
    title_size="18px",
    font_size="36px",
    align="center",
)
days_streak = pn.indicators.Number(
    value=0,
    name="Streak",
    colors=[(0, "red"), (30, "gold"), (60, "green")],
    title_size="18px",
    font_size="36px",
    align="center",
)
days_left = pn.indicators.Number(
    value=0,
    name="Days left",
    colors=[(0, "red"), (60, "gold"), (120, "green")],
    title_size="18px",
    font_size="36px",
    align="center",
)
indicators = pn.Column(
    pn.pane.HTML("<h2>🚀 Progress Tracker</h2>"),
    progress,
    pn.layout.Divider(),
    pn.Row(goals_completed, goals_missed, completion_rate, align="center"),
    pn.layout.Divider(),
    pn.Row(days_streak, days_left, align="center"),
    height=500,
)
# Define initial events
new_years_str = "2025-01-01"
marathon_dt = datetime.datetime(2025, 4, 21)
today = pd.to_datetime(datetime.datetime.now())
with sqlite3.connect("events.db") as conn:
    df = pd.read_sql("SELECT * FROM events", conn)
    if not df.empty:
        # Load events from database
        calendar.value = df.to_dict(orient="records")
    else:
        # Or add default events
        calendar.add_event(new_years_str, title="🎉 Happy New Year!")
        calendar.add_event(marathon_dt, title="🏃 Boston Marathon", color="red")
        events = [
            dict(start=date, title="❌ Train")
            for date in pd.date_range(new_years_str, marathon_dt, freq="D")
        ]
        calendar.add_events(events)
progress.max = len(calendar.value) - 2
# Set up event callbacks
calendar.event_click_callback = toggle_action
pn.bind(update_indicators, value=calendar.param.value, watch=True)
pn.bind(store_events, value=calendar.param.value, watch=True)
calendar.param.trigger("value")
# Display the app
pn.template.FastListTemplate(
    sidebar=[indicators],
    main=[calendar],
    title="📅 Marathon Training Calendar",
    accent_base_color="#D3D3D3",
    header_background="#36454F",
    theme="dark",
    sidebar_width=250,
).show()
Now, even if we turn off the computer running the server, the events will persist!
Enjoyed this post? Give Panel and this Panel-Full-Calendar project a star on GitHub to show your support! For more insights and guidance, explore our comprehensive documentation for both Panel and Panel-Full-Calendar. Have questions or want to join the discussion? Connect with us on Discord or Discourse—we’d love to hear from you!