This post is the first in a three-part series on the state of Python data visualization tools and the trends that emerged from SciPy 2018.
By James A. Bednar
At a special session of SciPy 2018 in Austin, representatives of a wide range of open-source Python visualization tools shared their visions for the future of data visualization in Python. We heard updates on Matplotlib, Plotly, VisPy, and many more. I attended SciPy 2018 as a representative of PyViz, GeoViews, Datashader, Panel, hvPlot and Bokeh, and my Anaconda colleague Jean-Luc Stevens attended representing HoloViews. This first post surveys the packages currently available and shows how they are linked, and subsequent posts will discuss how these tools have been evolving in recent years, and how they will go forward from here.
The Current Landscape
To set the stage, I showed Jake VanderPlas’s overview of how the many different visualization libraries in Python currently relate to each other:
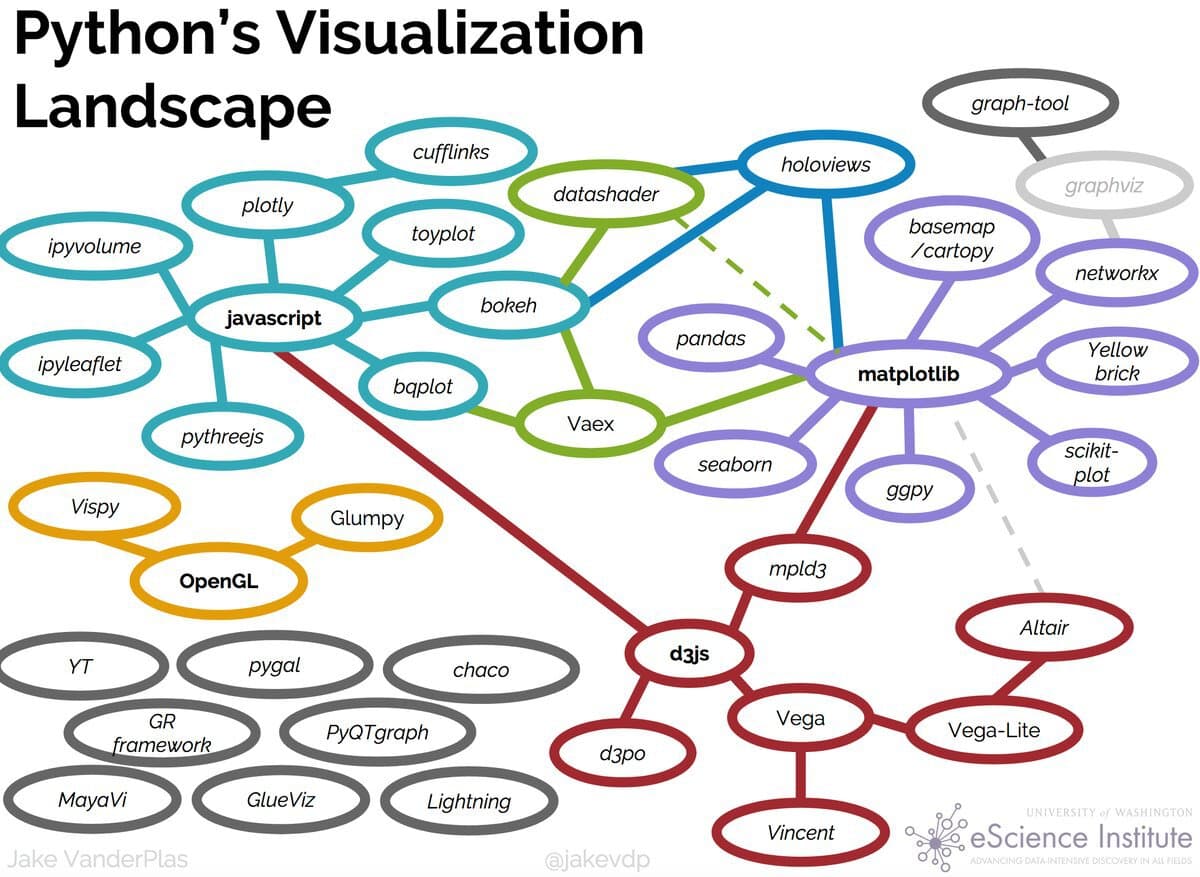
Here, you can see several main groups of libraries, each with a different origin, history, and focus. One clearly separable group is the “SciVis” libraries for visualizing physically situated data (in the lower left of the figure). These tools (VisPy, glumpy, GR, Mayavi, ParaView, VTK, and yt) primarily build on the 1992 OpenGL graphics standard, delivering graphics-intensive visualizations of physical processes in three or four dimensions (3D over time), for regular or irregularly gridded data. These libraries predate HTML5’s support for rich web applications, generally focusing on high-performance desktop-GUI applications in engineering or scientific contexts.
The other libraries nearly all fall into the “InfoVis” group, focusing on visualizations of information in arbitrary spaces, not necessarily the three-dimensional physical world. InfoVis libraries use the two dimensions of the printed page or computer screen to make abstract spaces interpretable, typically with axes and labels. The InfoVis libraries can be further broken down into numerous subgroups:
Matplotlib
One of the oldest and by far the most popular of the InfoVis libraries, released in 2003, with a very extensive range of 2D plot types and output formats. Matplotlib also predated HTML5’s support for rich web applications, focusing instead on static images for publication along with interactive figures using desktop-GUI toolkits like Qt and GTK. Matplotlib includes some 3D support, but much more limited than the SciVis libraries provide.
Matplotlib-based
A variety of tools have built on Matplotlib’s 2D-plotting capability over the years, either using it as a rendering engine for a certain type of data or in a certain domain (pandas, NetworkX, Cartopy, yt, etc.), or providing a higher-level API on top to simplify plot creation (ggplot, plotnine, HoloViews, GeoViews), or extending it with additional types of plots (seaborn, etc.).
JavaScript
Once HTML5 allowed rich interactivity in browsers, many libraries arose to provide interactive 2D plots for web pages and in Jupyter notebooks, either using custom JS (Bokeh, Toyplot) or primarily wrapping existing JS libraries like D3 (Plotly, bqplot). Wrapping existing JS makes it easy to add new plots created for the large JS market (as for Plotly), while using custom JS allows defining lower level JS primitives that can be combined into completely new plot types from within Python (as for Bokeh).
JSON
As JavaScript libraries like D3 have matured, their functionality has been captured in declarative JSON specifications (Vega, Vega-Lite), making it simple to generate JavaScript plots from any language, now including Python (via Altair and previously via vincent). Having the full plot specification available as portable JSON allows integration across many types of tools.
WebGL
Just as HTML5 did for 2D JavaScript plotting, the WebGL standard made 3D interactivity in the browser and Jupyter feasible, leading to 3D in-browser plotting built on three.js (pythreejs, ipyvolume), vtk.js (itk-jupyter-widgets), or regl (Plotly). None of these newer web-based 3D approaches approach the breadth and depth of the desktop SciVis 3D libraries, but they do allow full integration with Jupyter notebooks and easy sharing and remote usage via the web. So even though WebGL tools have some applications in common with the SciVis tools, they are probably more closely tied with the other InfoVis tools.
Other
Many other libraries, even beyond those listed in Jake’s diagram, provide other complementary functionality (e.g. graphviz for visualizing networks).
Differentiating Factors Between Viz Tools
The above breakdown by history and technology helps explain how we got to the current profusion of Python viz packages, but it also helps explain why there are such major differences in user-level functionality between the various packages. Specifically, there are major differences in the supported plot types, data sizes, user interfaces, and API types that make the choice of library not just a matter of personal preference or convenience, and so they are very important to understand:
Plot Types
The most basic plot types are shared between multiple libraries, but others are only available in certain libraries. Given the number of libraries, plot types, and their changes over time, it is very difficult to precisely characterize what’s supported in each library, but it is usually clear what the focus is if you look at the example galleries for each library. As a rough guide:
Statistical plots (scatter plots, lines, areas, bars, histograms): Covered well by nearly all InfoVis libraries, but are the main focus for Seaborn, bqplot, Altair, ggplot2, plotnine
Images, regular grids, rectangular meshes: Well supported by Bokeh, Datashader, HoloViews, Matplotlib, Plotly, plus most of the SciVis libraries
Irregular 2D meshes (triangular grids): Well supported by the SciVis libraries plus Matplotlib, Bokeh, Datashader, HoloViews
Geographical data: Matplotlib (with Cartopy), GeoViews, ipyleaflet, Plotly
Networks/graphs: NetworkX, Plotly, Bokeh, HoloViews, Datashader
3D (meshes, scatter, etc.): Fully supported by the SciVis libraries, plus some support in Plotly, Matplotlib, HoloViews, and ipyvolume.
Data Size
The architecture and underlying technology for each library determine the data sizes supported, and thus whether the library is appropriate for large images, movies, multidimensional arrays, long time series, meshes, or other sizeable datasets:
SciVis: Can generally handle very large gridded datasets, gigabytes or larger, using compiled data libraries and native GUI apps.
Matplotlib-based: Can typically handle hundreds of thousands of points with reasonable performance, or more in some special cases (e.g. depending on backend).
JSON: Without special handling, JSON’s text-based encoding of data limits JSON-based specifications to a few thousand points up to a few hundred thousand points, due to the file sizes and text processing required.
JavaScript: ipywidgets, Bokeh, and Plotly all use JSON but augment it with additional binary-data transport mechanisms so that they can handle hundreds of thousands to millions of data points.
WebGL: JavaScript libraries using an HTML Canvas are limited to at most hundreds of thousands of points for good performance, but WebGL (via ipyvolume, Plotly, and in some cases Bokeh) allows up to millions.
Server-side rendering: External InfoVis server-side rendering from Datashader or Vaex allows billions, trillions, or more data points in web browsers, by converting arbitrarily large distributed or out-of-core datasets into fixed-sized images to embed in the client browser.
Because of the wide range in data size (and thus to some extent data type) supported by these types of libraries, users needing to work with large sizes will need to choose appropriate libraries at the outset.
User Interfaces and Publishing
The various libraries differ dramatically in the ways that plots can be used.
Static Images: Most libraries can now operate headlessly to create static images, at least in PNG and typically in smooth vector formats like SVG or PDF.
Native GUI app: The SciVis libraries plus Matplotlib and Vaex can create OS-specific GUI windows, which provide high performance, support for large data sets, and integration with other desktop applications, but are tied to a specific OS and usually need to run locally rather than over the web. In some cases, JavaScript-based tools can also be embedded in native apps by embedding a web browser.
Export to HTML: Most of the JavaScript and JSON libraries can be operated in a serverless mode that generates interactive plots (zooming, panning, etc.) that can be emailed or posted on web servers without Python available.
Jupyter notebooks: Most InfoVis libraries now support interactive use in Jupyter notebooks, with JavaScript-based plots backed by Python. The ipywidgets-based projects provide tighter integration with Jupyter, while some other approaches give only limited interactivity in Jupyter (e.g. HoloViews when used with Matplotlib rather than Bokeh).
Standalone web-based dashboards and apps: Plotly graphs can be used in separate deployable apps with Dash, and Bokeh, HoloViews, and GeoViews can be deployed using Bokeh Server. Most of the other InfoVis libraries can be deployed as dashboards using the new Panel library, including at least Matplotlib, Altair, Plotly, Datashader, hvPlot, Seaborn, plotnine, and yt. However, despite their web-based interactivity, the ipywidgets-based libraries (ipyleaflet, pythreejs, ipyvolume, bqplot) are difficult to deploy as public-facing apps because the Jupyter protocol allows arbitrary code execution (but see the defunct Jupyter dashboards project and flask-ipywidgets for potential solutions).
Users thus need to consider whether a given library will cover the range of uses they expect for their visualizations.
API types
The various InfoVis libraries offer a huge range of programming interfaces suitable for very different types of users and different ways of creating visualizations. These APIs differ by orders of magnitude in how much code is needed to do common tasks and in how much control they provide to the user for handling uncommon tasks and for composing primitives into new types of plots:
Object-oriented Matplotlib API: Matplotlib’s main API, allowing full control and compositionality but complex and highly verbose for some common tasks like creating subfigures.
Imperative Pyplot API: Matplotlib’s basic interface allows Matlab-style imperative commands, which are concise for simple cases but not compositional and thus largely limited to a specific set of supported options.
Imperative Pandas .plot() APIs: Centered around dataframes, where users will primarily prepare the data in Pandas, then select a subset for plotting. As will be discussed in the next post in this series, now supported for a wide range of charting libraries and also for other data structures, making them a useful basic set of broadly supported basic plotting commands. Not directly compositional, but can return composable objects from an underlying plotting library (as for hvPlot).
Declarative graphics APIs: The Grammar of Graphics-inspired libraries like ggplot, plotnine, Altair, and (to some extent) Bokeh provide a natural way to compose graphical primitives like axes and glyphs to create a full plot.
Declarative data APIs: Building on the native APIs for other libraries, HoloViews and GeoViews provide a much higher level declarative and compositional API focusing on annotating, describing, and working with visualizable data, rather than plot elements.
Each of these APIs is suited to users with different backgrounds and goals, making some tasks easy and concise, and others more difficult. Apart from Matplotlib, most libraries support one or at most two alternative APIs, making it important to choose a library whose approach fits with each user’s technical background and preferred workflows.
Emerging Trends
As you can see, there is a huge range of visualization functionality available for Python, with a diversity in approach and focus that is reflected in the large number of libraries available. Differences between approaches remain important and have far-reaching implications, meaning that users need to take these differences into consideration before investing deeply into any particular approach. But as we saw at SciPy 2018, trends toward convergence are helping make it less crucial which libraries users select. To learn more about these emerging trends, stay tuned for Part II of this series, Python Data Visualization 2018: Moving Toward Convergence.