Interactive data exploration and data apps are a passion of mine. I want to make it easy for scientists, engineers, analysts, data scientists, domain experts, and YOU to develop awesome, interactive data tools and apps using the tools you know and love.
As such, I have made a number of contributions to Panel and the HoloViz ecosystem. These contributions include:
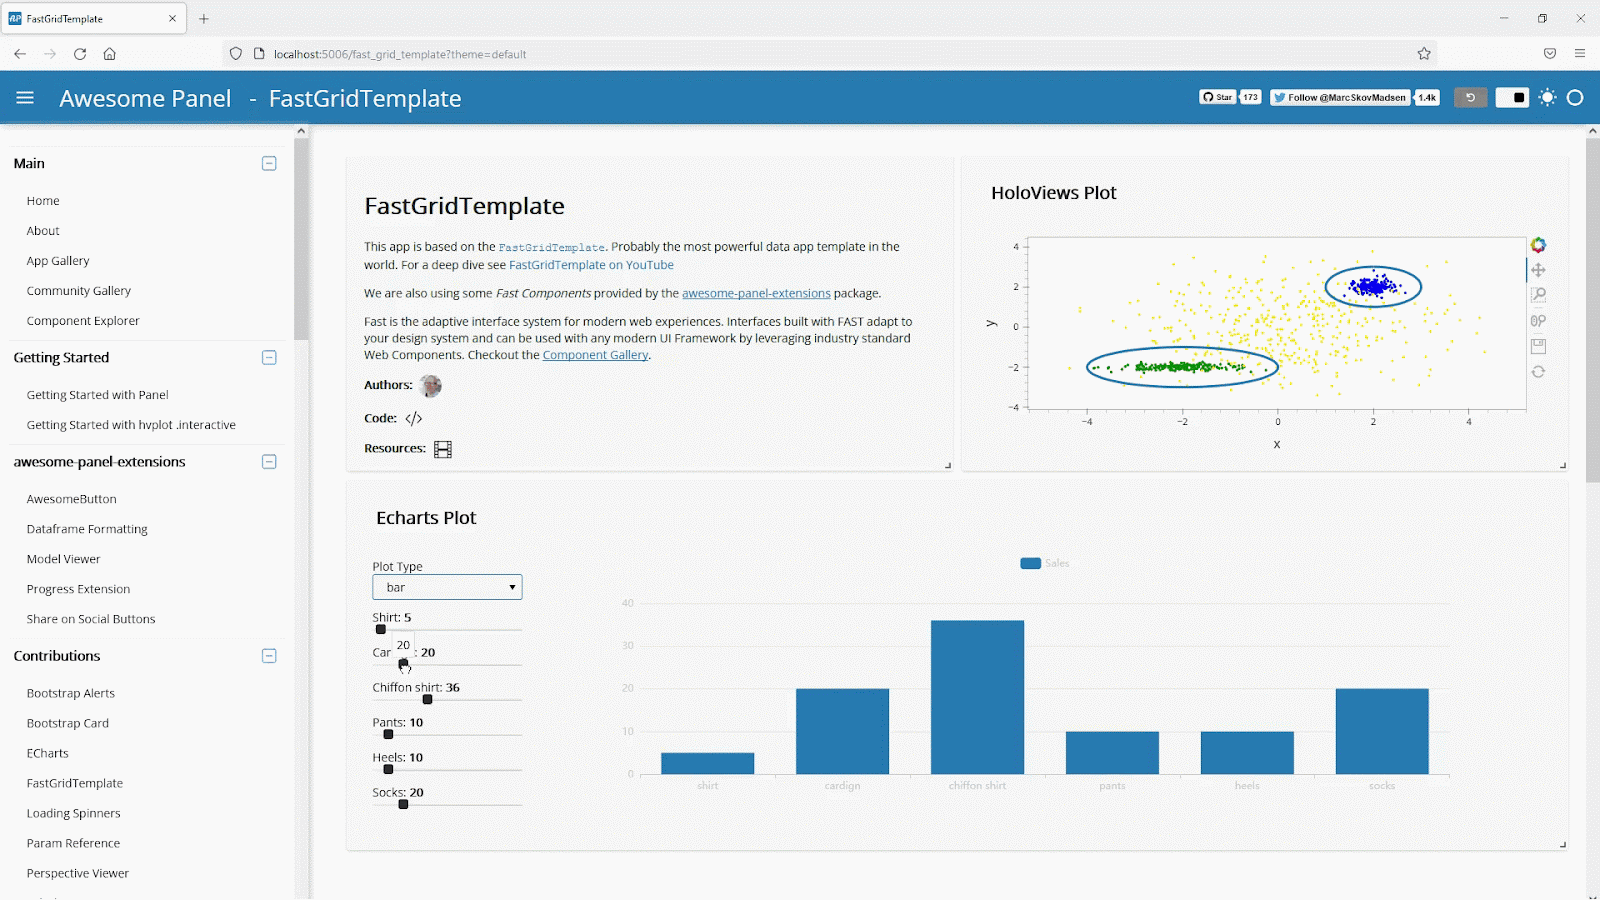
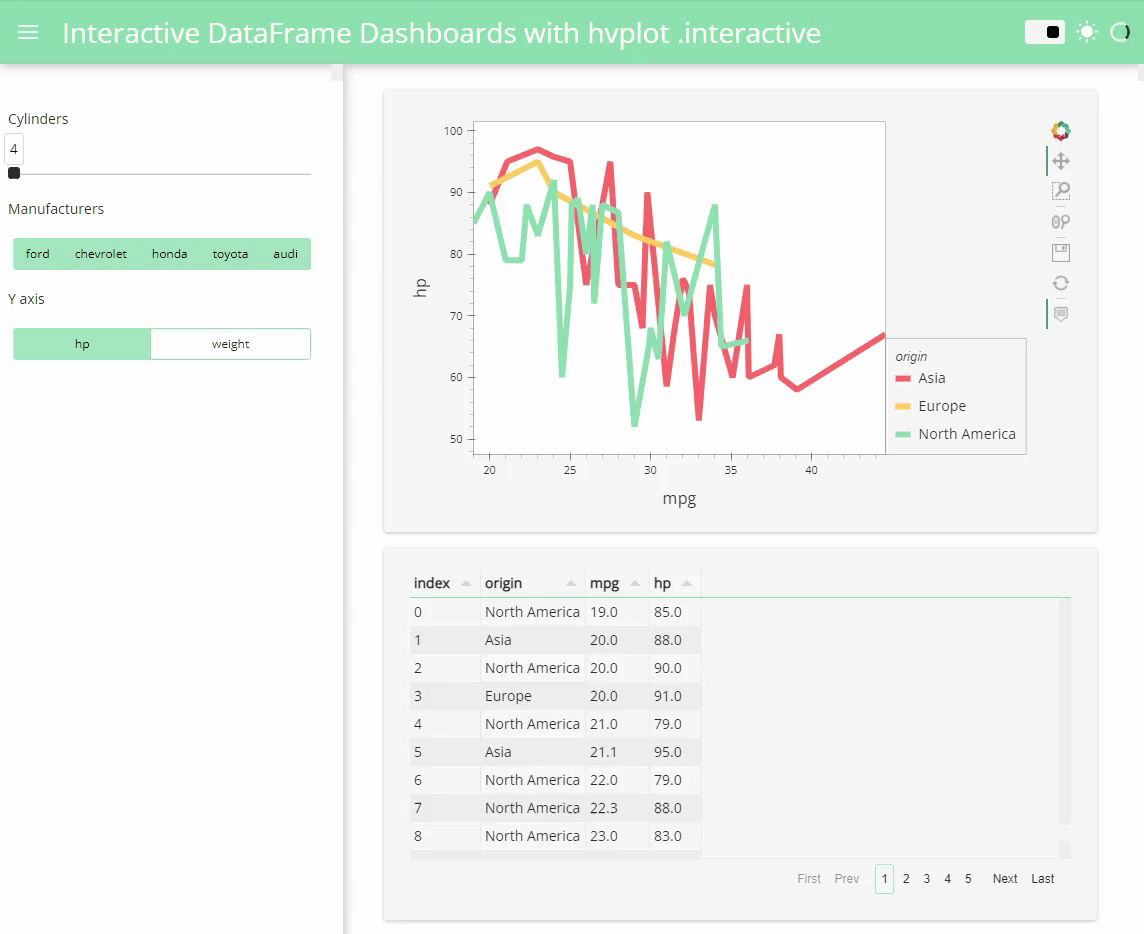
The FastGridTemplate below
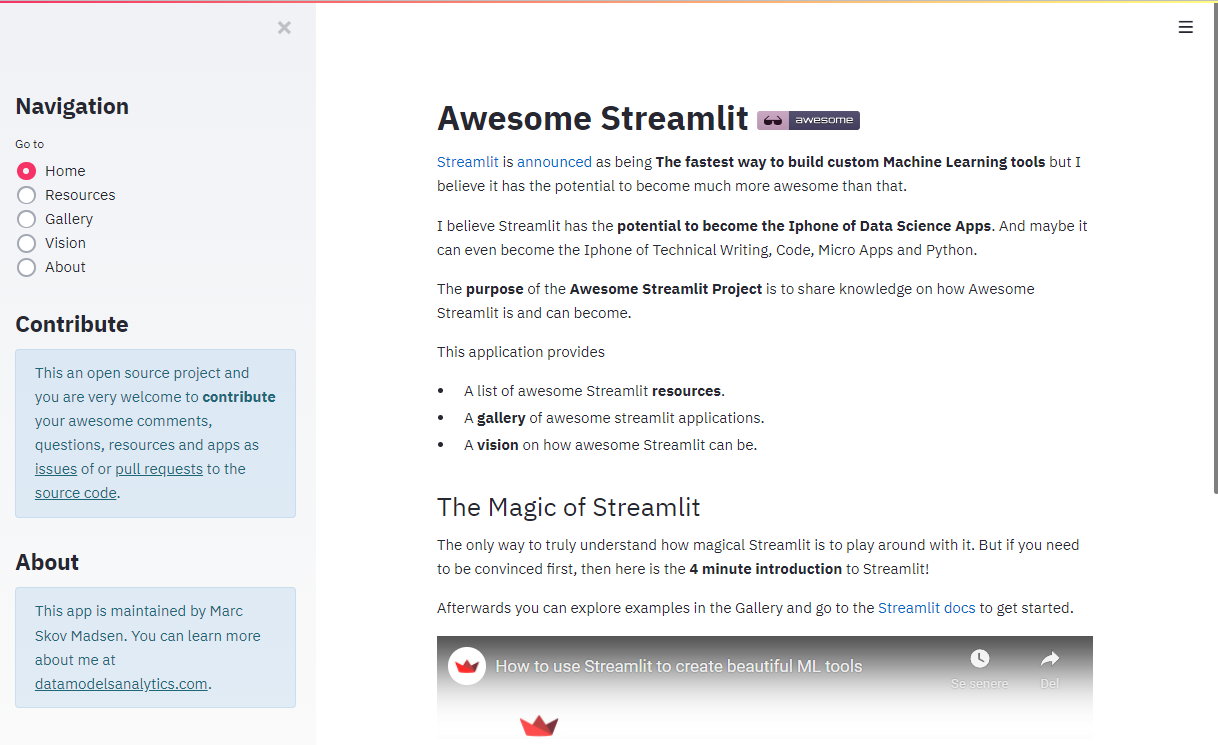
Two very popular sites: awesome-streamlit.org and awesome-panel.org
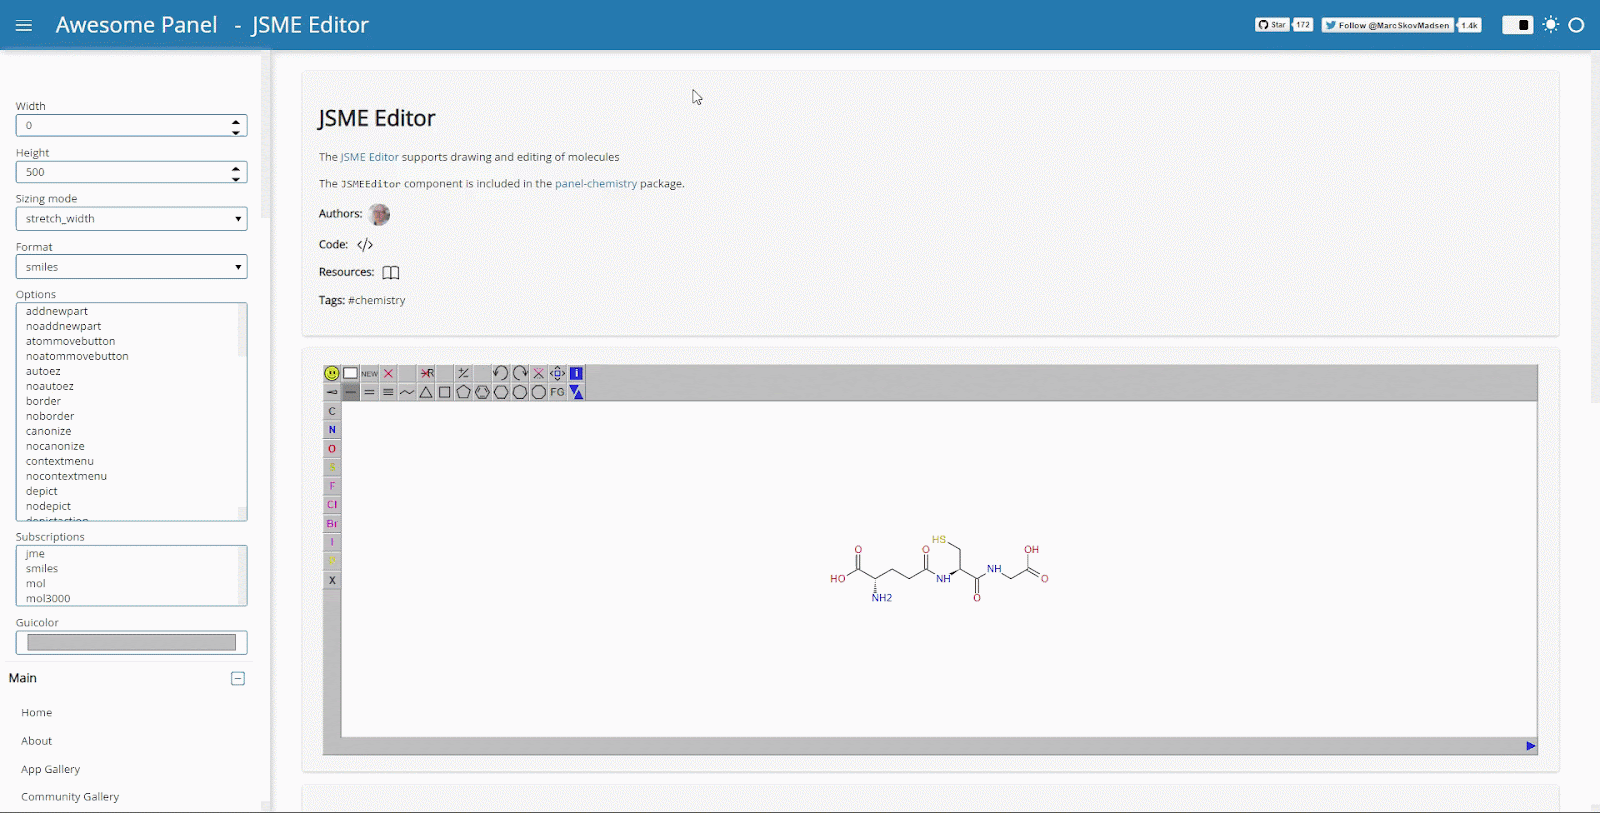
Popular Python packages like panel-highcharts and panel-chemistry
How It All Began
In 2019 I was transitioning from a project manager role to a lead data scientist role at Ørsted. I started learning Python, and the first step in that journey was figuring out how to productionize data and models using Python. I started creating applications using Django REST API on the backend and Angular on the frontend.
I soon realized this was not a great solution. The main issues were:
An extended time to market (TTM)
The complexity of learning, developing, and maintaining two technology stacks
- Users, domain experts, and data scientists were far removed from the end product
They could not use the tools they knew and loved
We could not collaborate
To solve these issues, I started looking at pure Python data app frameworks. I looked at Bokeh, Dash, Streamlit, and Voila. In the process, I made awesome-streamlit.org, which has helped many users get started with Streamlit and has +1100 stars on Github.
But none of these frameworks would support all of our use cases. I ended up looking at Panel and found that it had the potential to support all our needs. (Check out this blog post for details.)
Making Panel Work Better
At the start of 2020, Panel was nothing like it is today. It needed feedback and improvement. So the first contributions I made to Panel were Github issues. Well-prepared Github issues with context and a minimum reproducible examples are gifts to an open-source project. Luckily Philipp Rudiger, the lead developer of Panel, and other maintainers had the time and energy to improve things.
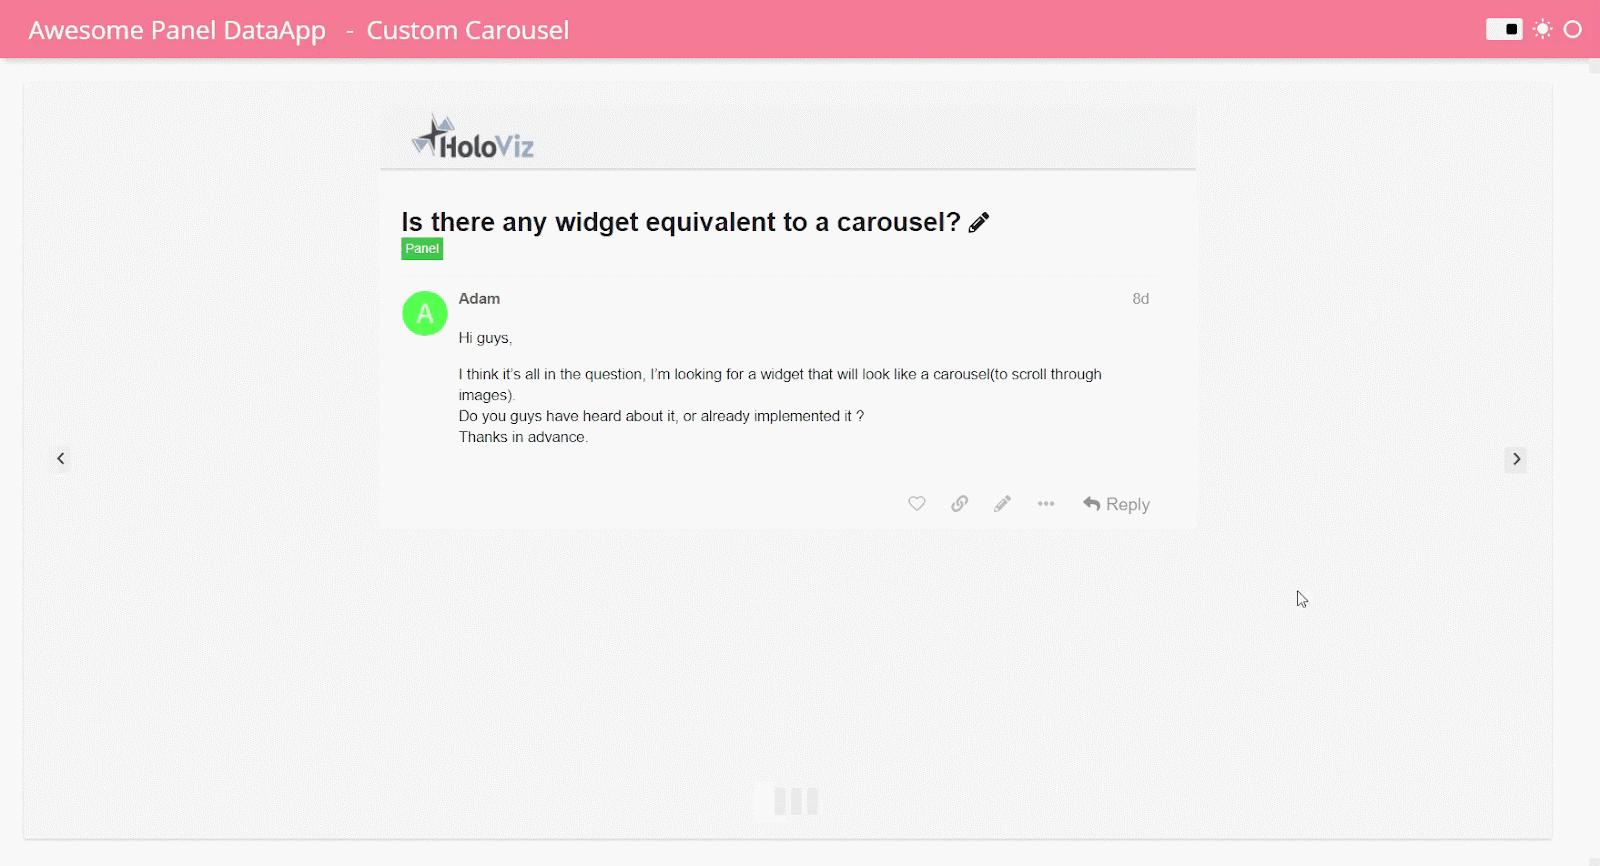
One of my first requests (#831) was for a discourse site for Panel and the HoloViz ecosystem such that we could start building a community and knowledge base. Since then, I’ve been helping users on Discourse make cool tools and data apps. For an example, check out this Is there any widget equivalent to a carousel? topic.
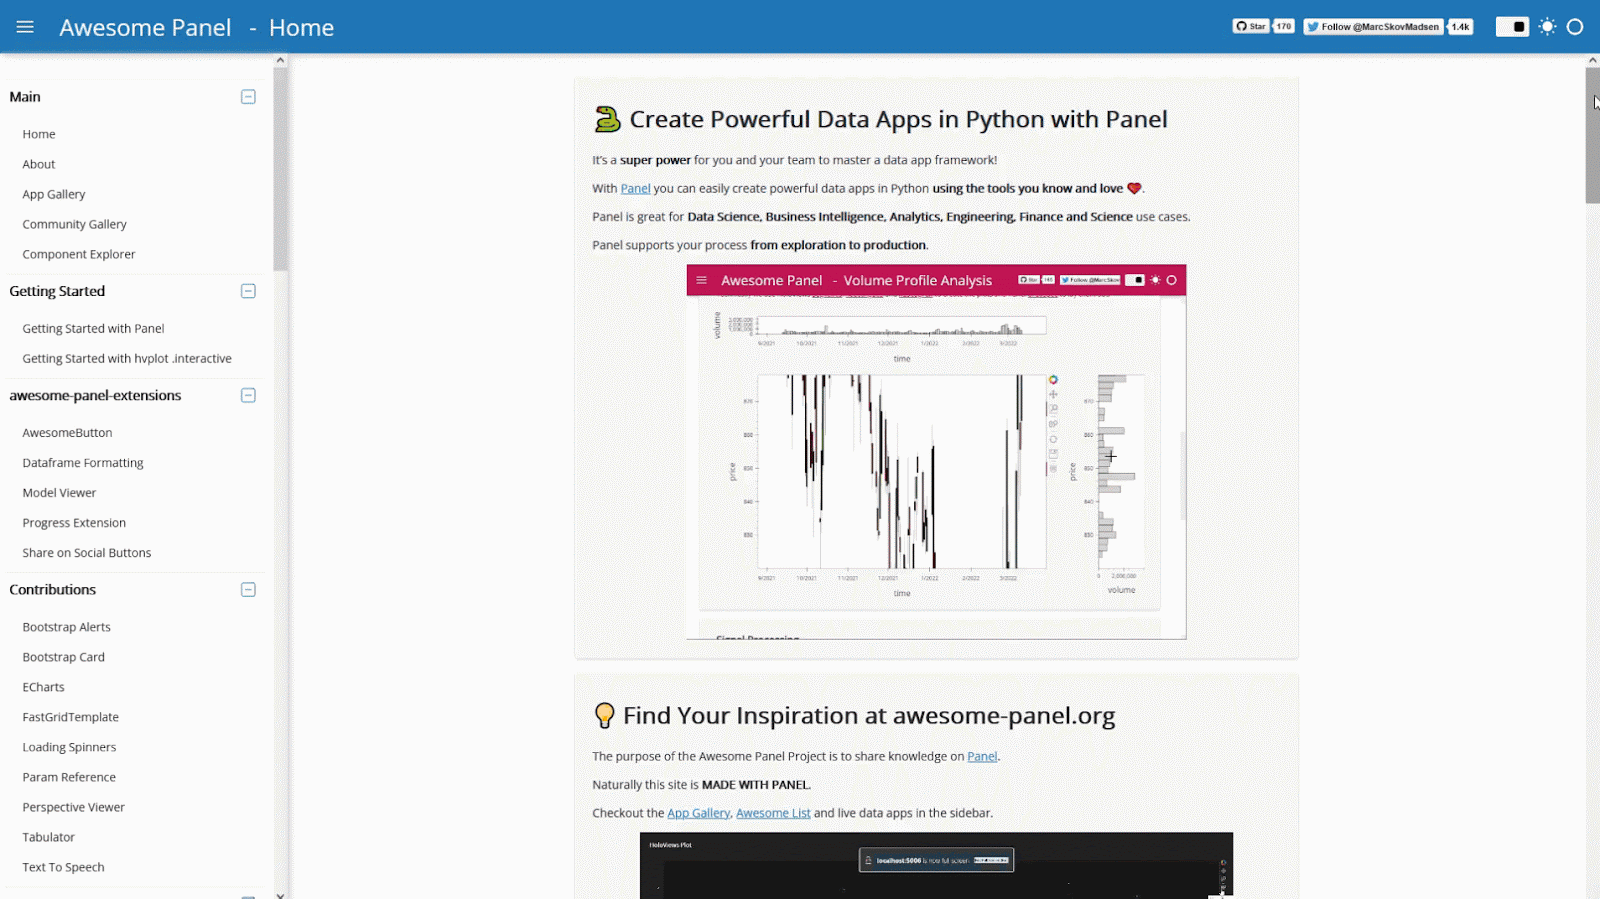
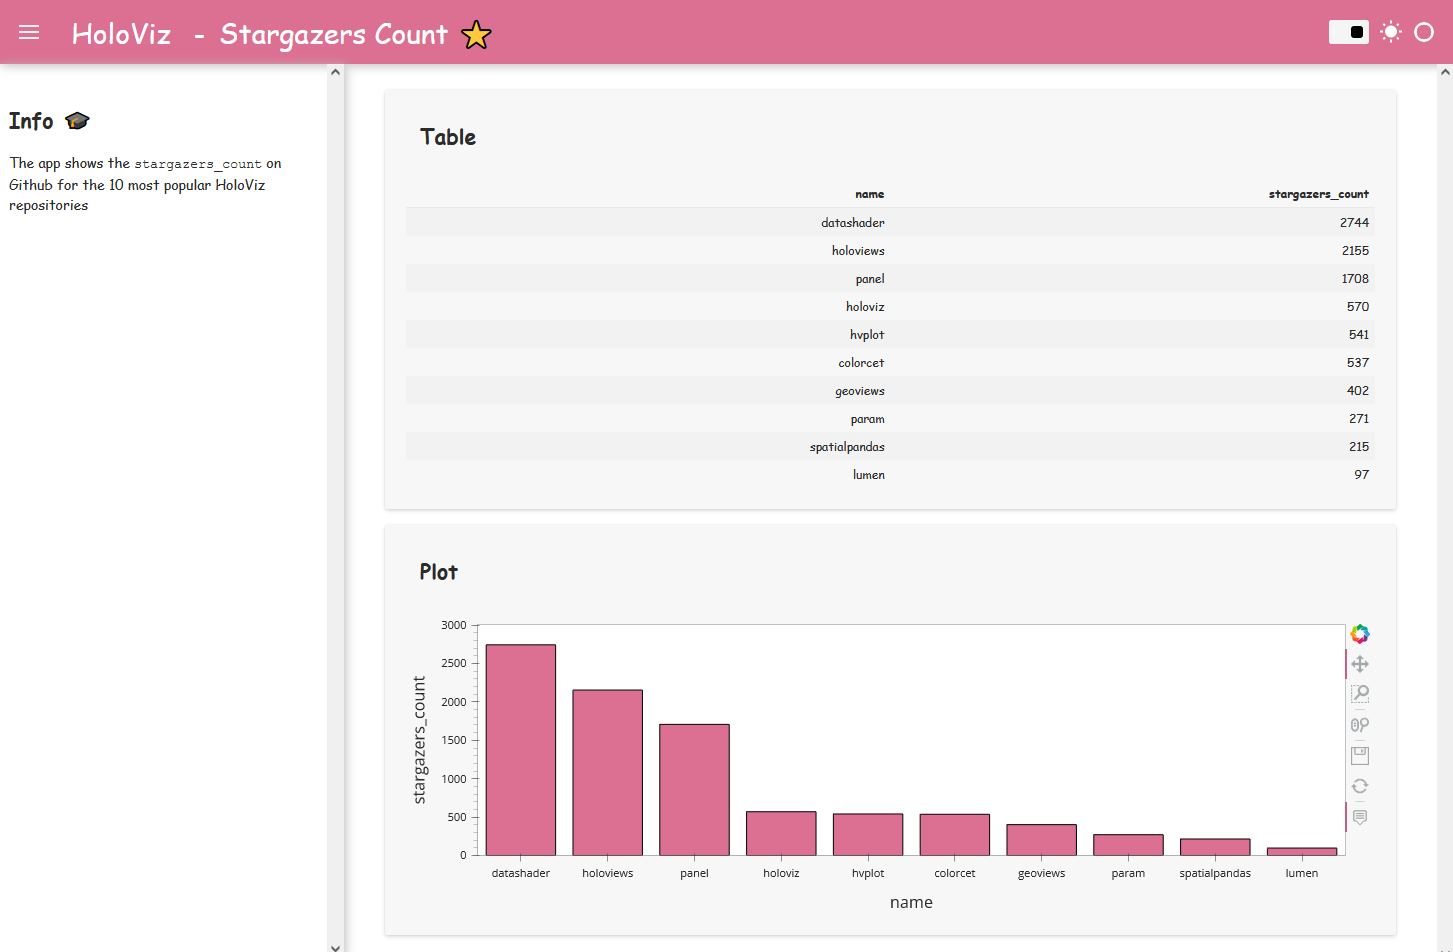
After the initial exploration, the next step was to create awesome-panel.org to demonstrate what was possible and push Panel development forward. Awesome-panel.org is, of course, one big, multi-page app built using Panel.
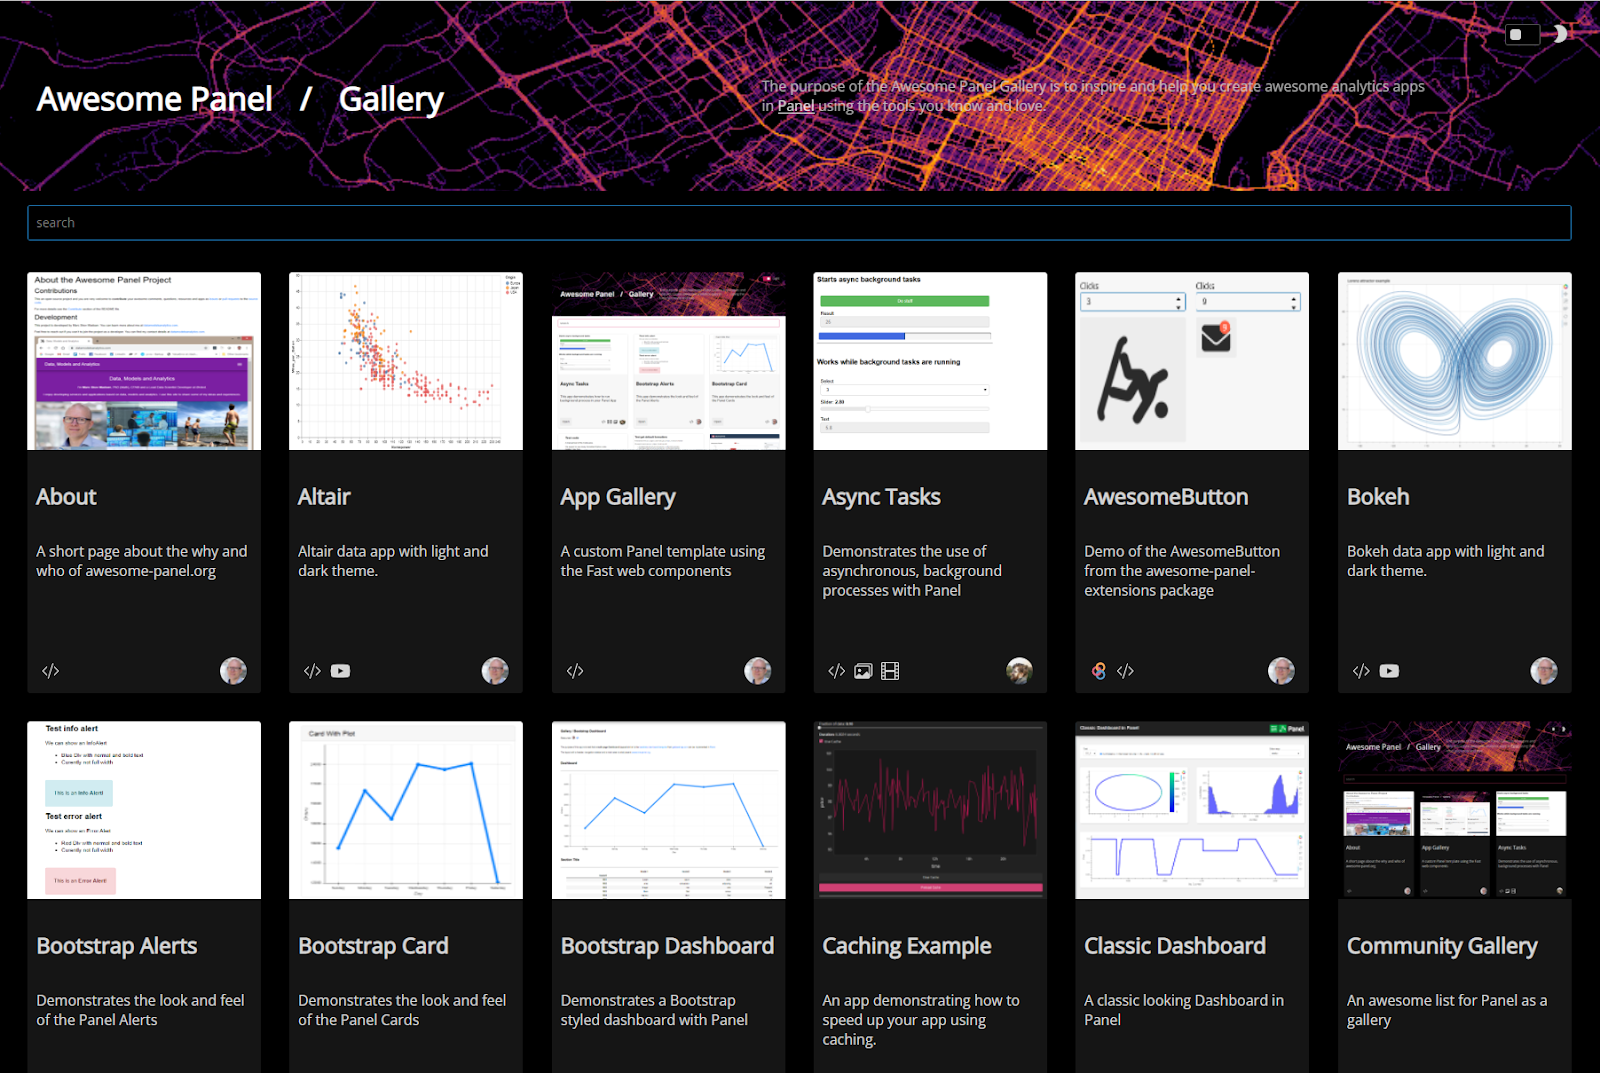
The site now contains an extensive collection of data apps with code for inspiration. Check out the App Gallery.
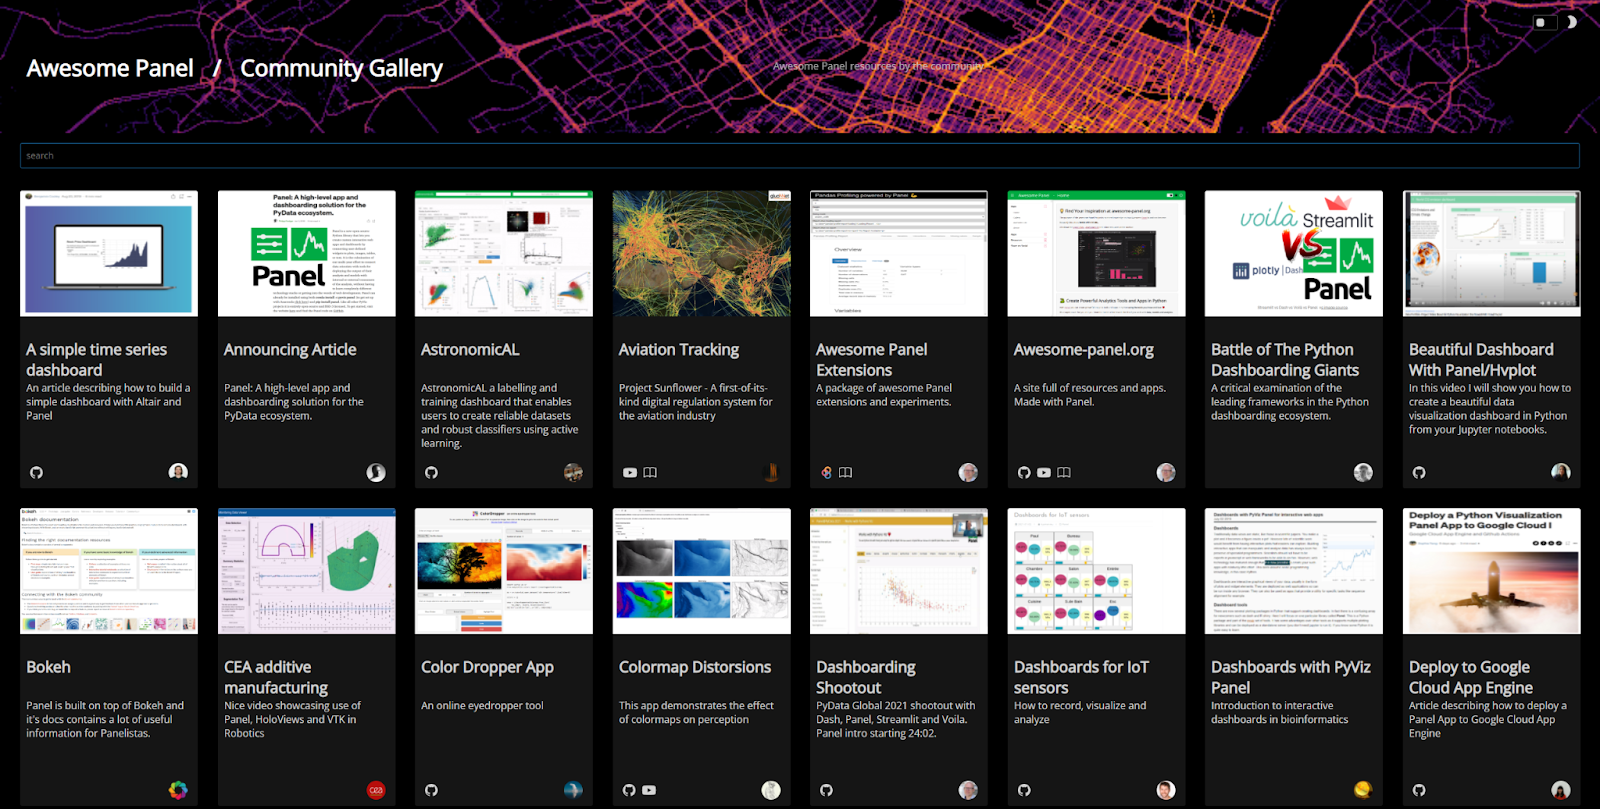
The site also contains an awesome list on steroids for inspiration. Check out the Awesome List.
Along the way I made or contributed to many Panel components, such as the Trend indicator on the right side below.
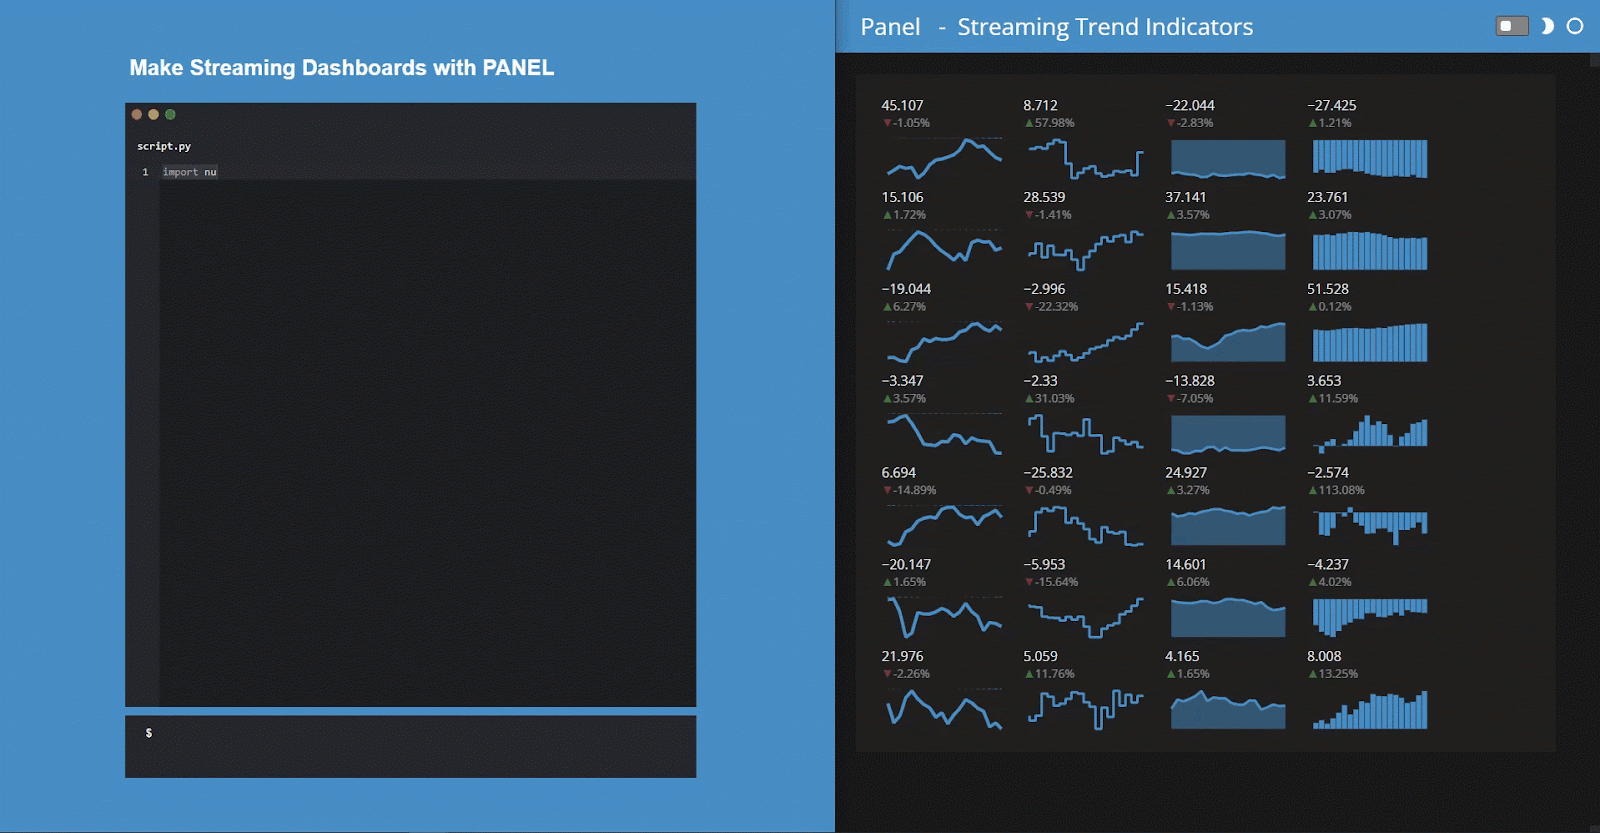
Please note that on the left-hand side is, of course, a streaming Panel app I also made.
Making Panel Look Better
One of the things that was holding Panel back was its look and feel. Streamlit has an easy-to-use, attractive template. Panel needed one as well. So I forced myself into the world of HTML, CSS, and Javascript to contribute to the FastListTemplate. You can see it in action below.
Later I contributed the FastGridTemplate. Check out this relevant Deep Dive video.
Making Friends
Making it alone would not be possible. Sometimes I’ve only had the vision, and others were the makers and vice versa. And now a lot of people in the community are my friends.
For example, I’m especially happy about the –autoreload flag that speeds up your development process when working in a .py file and the Jupyter Panel Preview that does the same when working in a notebook. Philipp Rudiger was the maker; I only had the idea.
Today I’m the owner of a Jupyter Hub for Market Trading at Ørsted and part of a team developing data platforms and applications in VS Code and PyCharm. I’m so happy that Panel can support use cases across skill levels and development environments. We can start to collaborate! Making the PyData and Jupyter ecosystems as easy and fast to use as Excel is a long-term process.
I would like to thank Maxime Liquet and Simon Høxbro Hansen for making a lot of the not-so-visible but needed improvements to the HoloViz ecosystem and Panel in particular.
I would also like to thank Sophia Yang, who shares her passion for Panel and the HoloViz ecosystem on social media. Follow her on Medium and Twitter.
Final Call to Action
Please support Panel and awesome-panel.org by giving them a ⭐ on Github.
Please follow me on Twitter and LinkedIn if you want to learn more about the things I make. And if you have a passion for documentation, please consider helping Panel make awesome documentation. That is the next big step that needs to be taken.
About the Author
Mark Skov Madsen, PhD, CFA, is a Lead Trading Analyst at Ørsted. His team develops data, models, and analytics for Ørsted’s Traders end to end. They work in an analytics environment based on Azure DevOps, Kubernetes, JupyterHub and Python.
Marc has been working in financial and physical asset management in the finance and energy sectors since 2004, holding titles such as Head of Quantitative Research, Innovation Manager, BI Specialist, Data Science Developer, and more.
Marc has long been architecting and developing data-driven frameworks, platforms, tools, and applications. He created BI tools “before they were a thing” and has made all kinds of custom tools and systems for managing assets, intelligence, risk, and performance.
In his spare time, Marc works to help make Python and open-source software powerful and easy to use so more people can transition from Excel, Matlab, etc. to Python.