- Log in to Workbench, select the Menu icon in the top right corner and click the Administrative Console link displayed at the bottom of the slide out window.
- Click Manage Resources.
- Login to the Operations Center using the Administrator credentials configured after installation
Total cluster resource utilization
The Dashboard tab in the Operations Center displays the total CPU and Memory utilize aggregated across all nodes (master and worker) nodes in the Anaconda Enterprise cluster.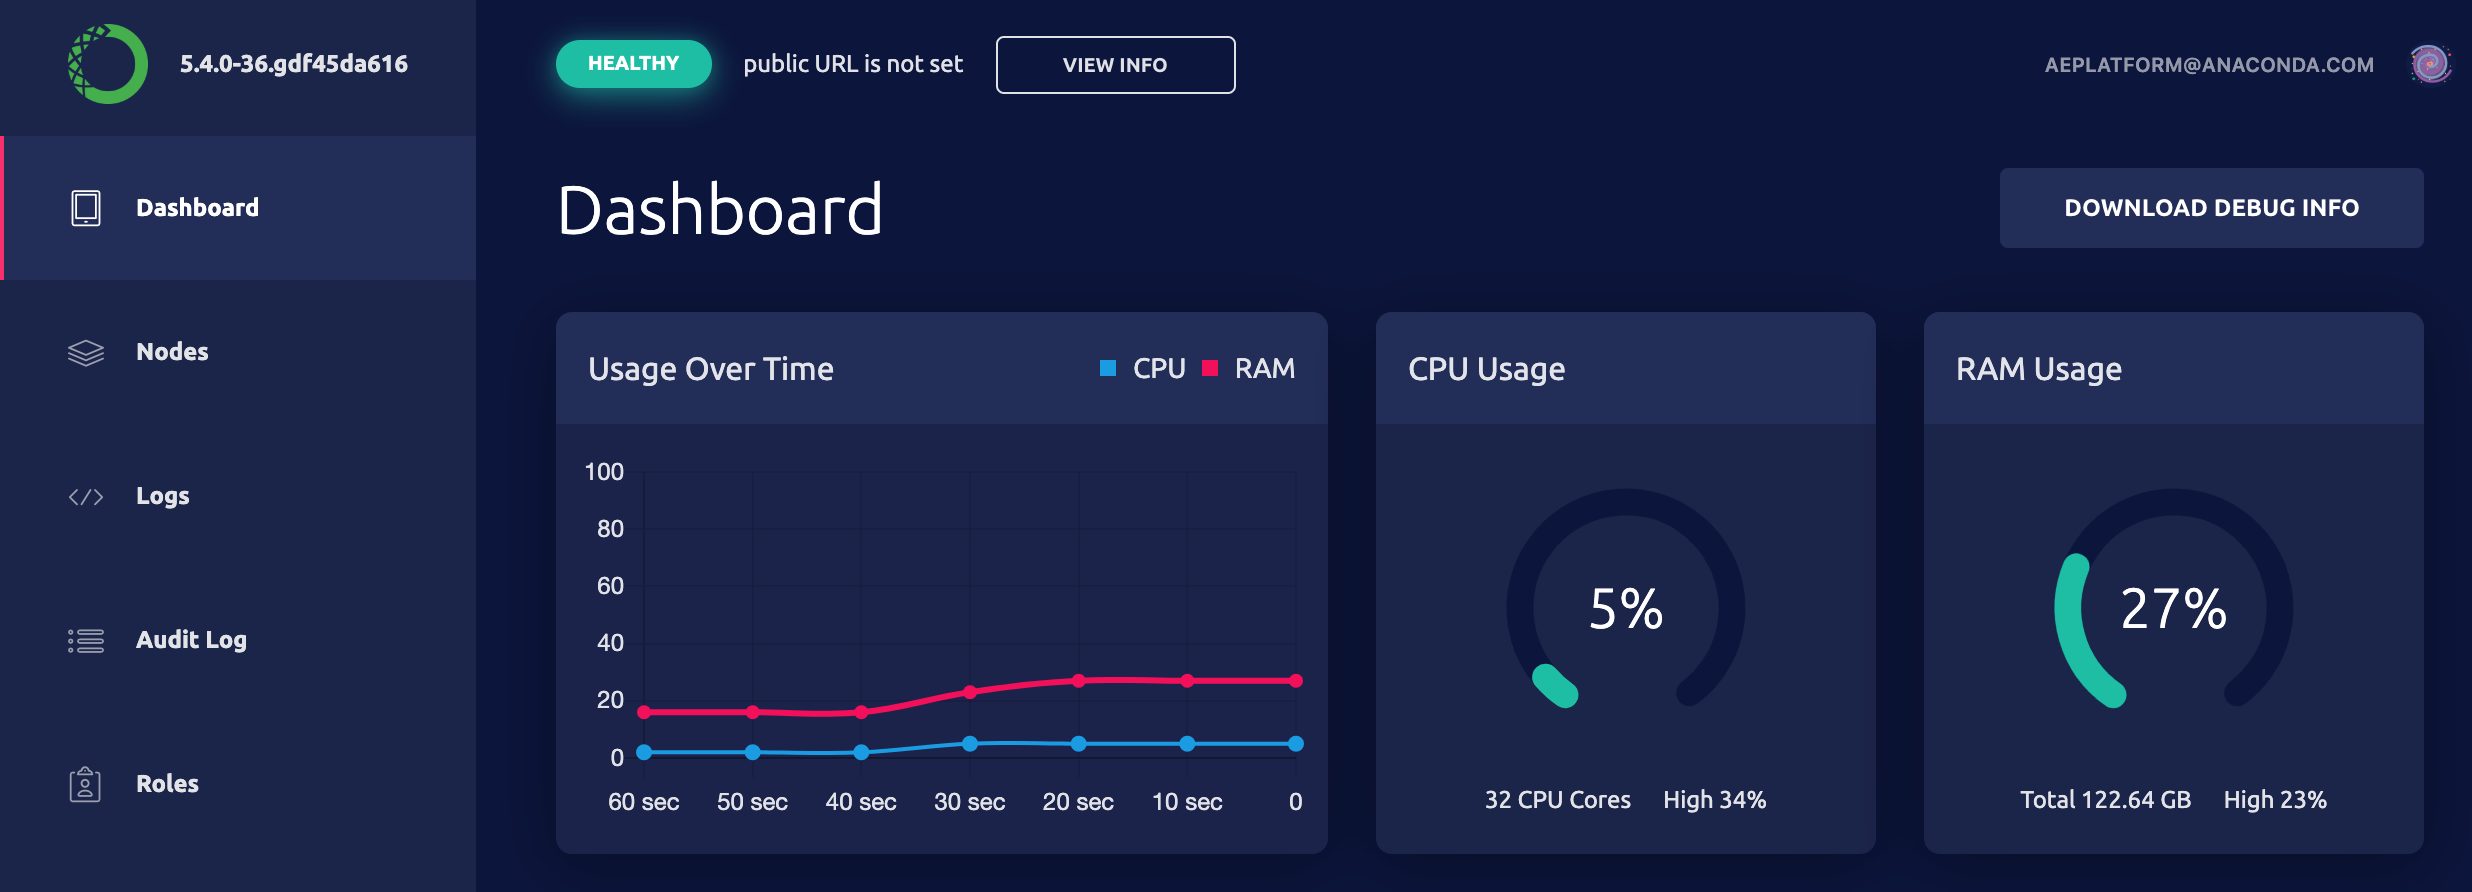
Monitoring dashboard
- Click Monitoring in the menu on the left.
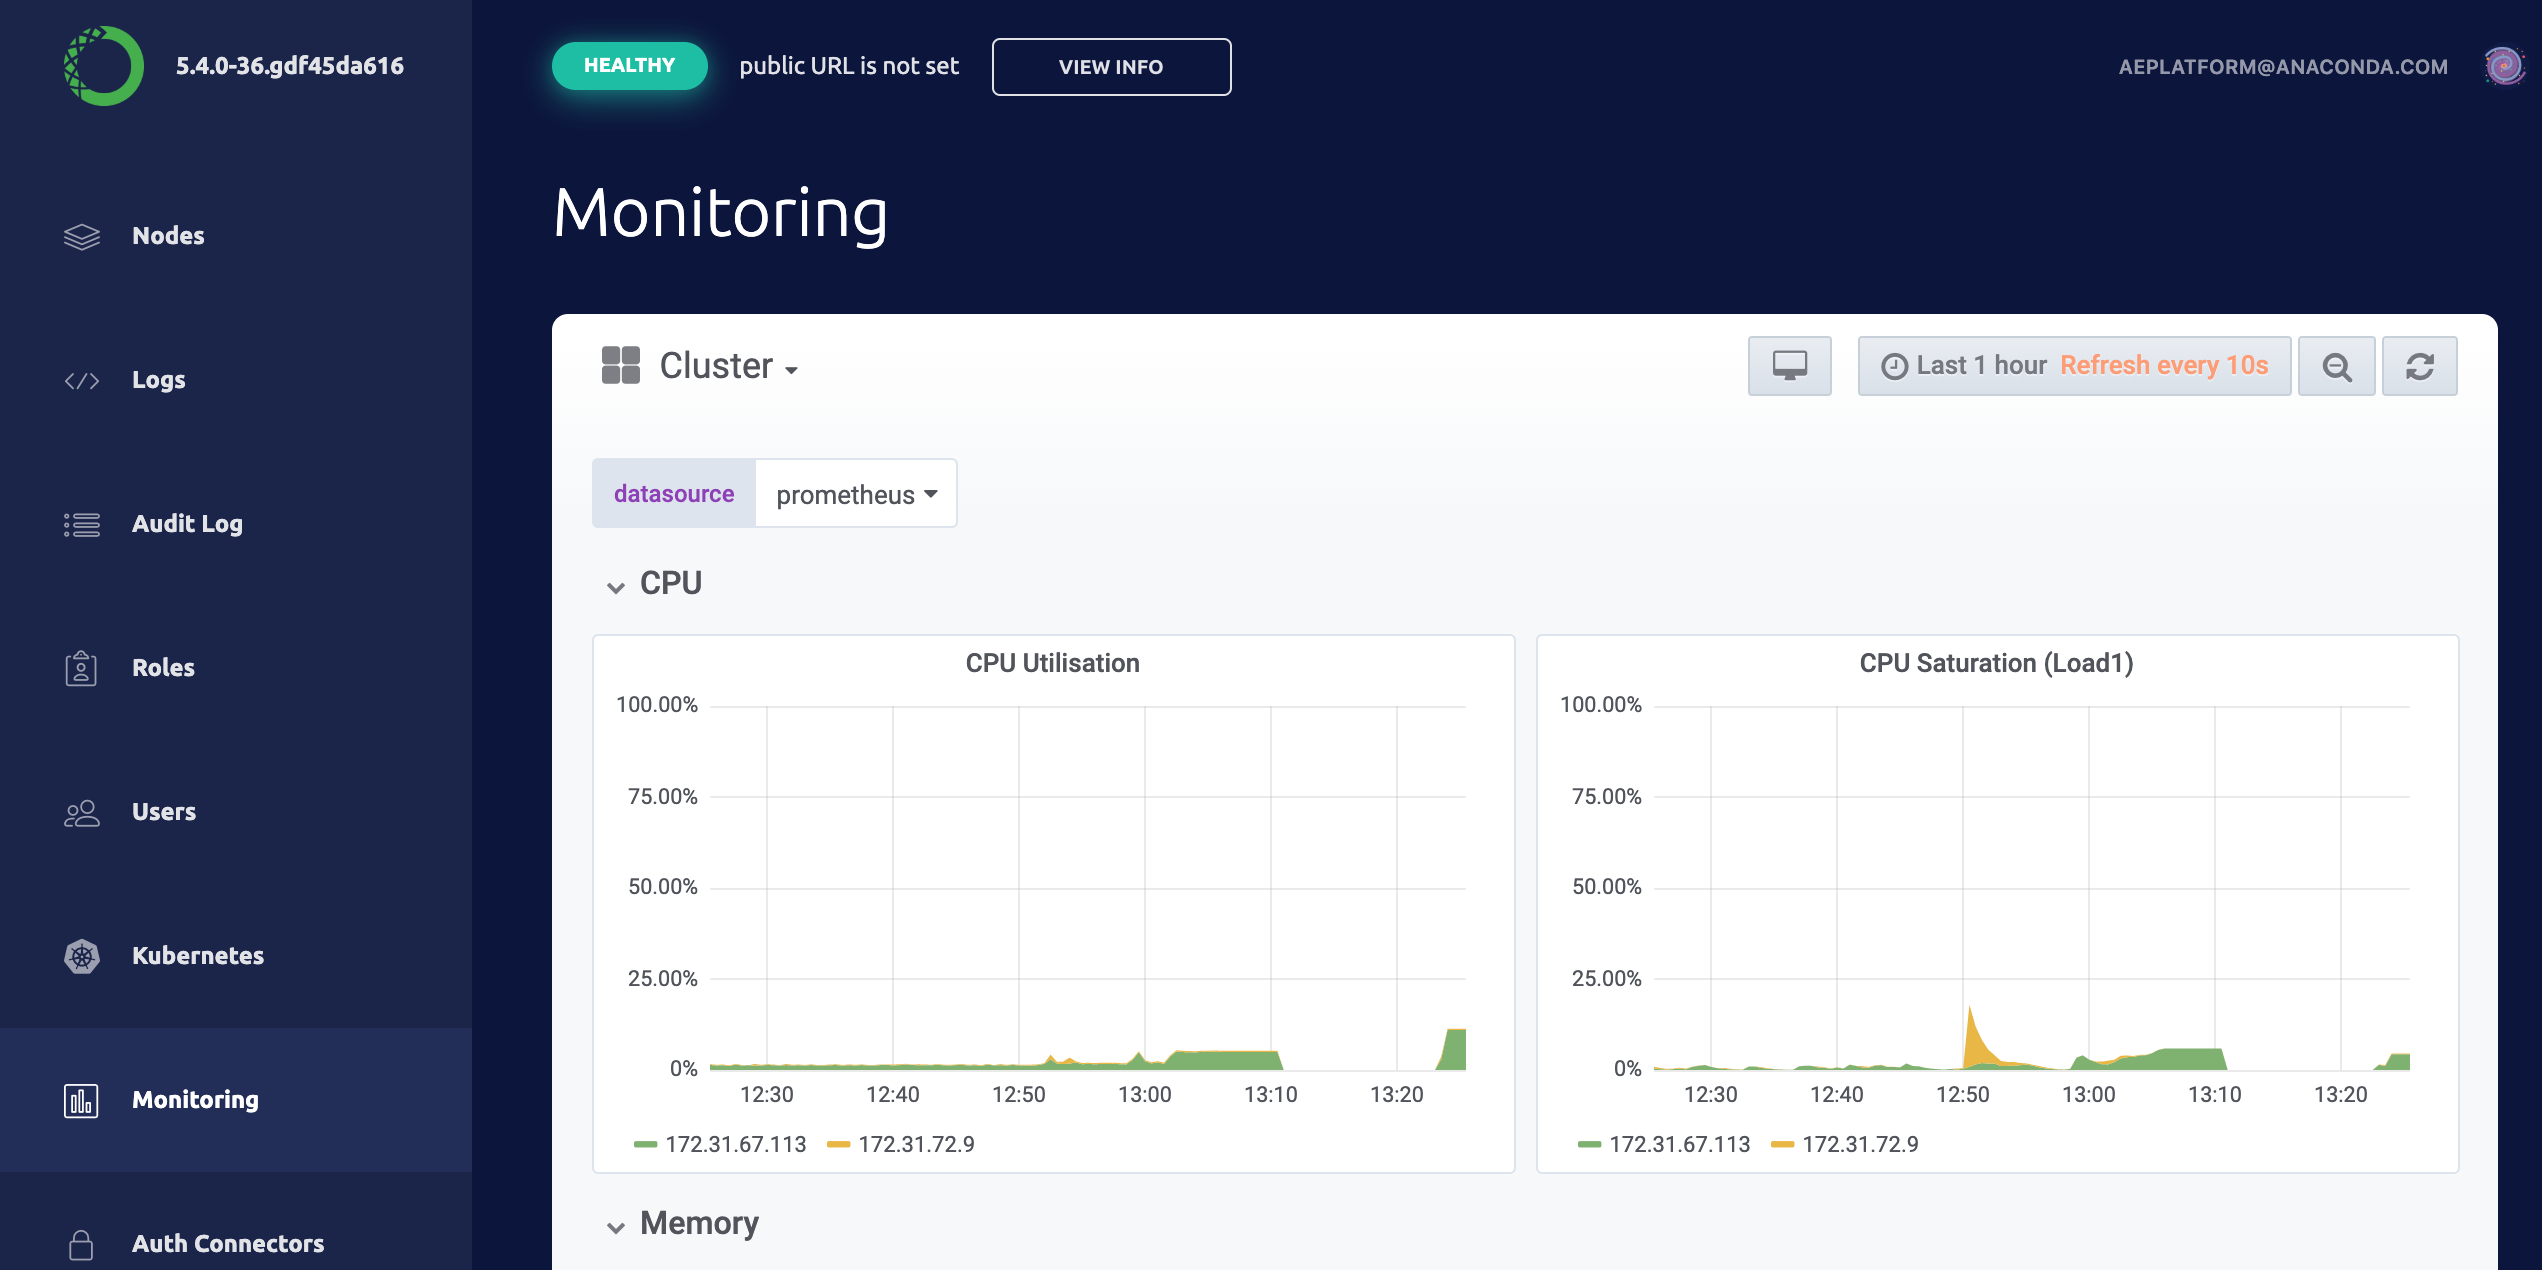
- Overall Cluster CPU Usage
- CPU Usage by Node
- Individual CPU Usage
- Overall Cluster Memory Usage
- Memory Usage by Node
- Individual Node Memory Usage
- Overall Cluster Network Usage
- Network Usage by Node
- Individual Node Network Usage
- Overall Cluster Filesystem Usage
- Filesystem Usage by Node
- Individual Filesystem Usage
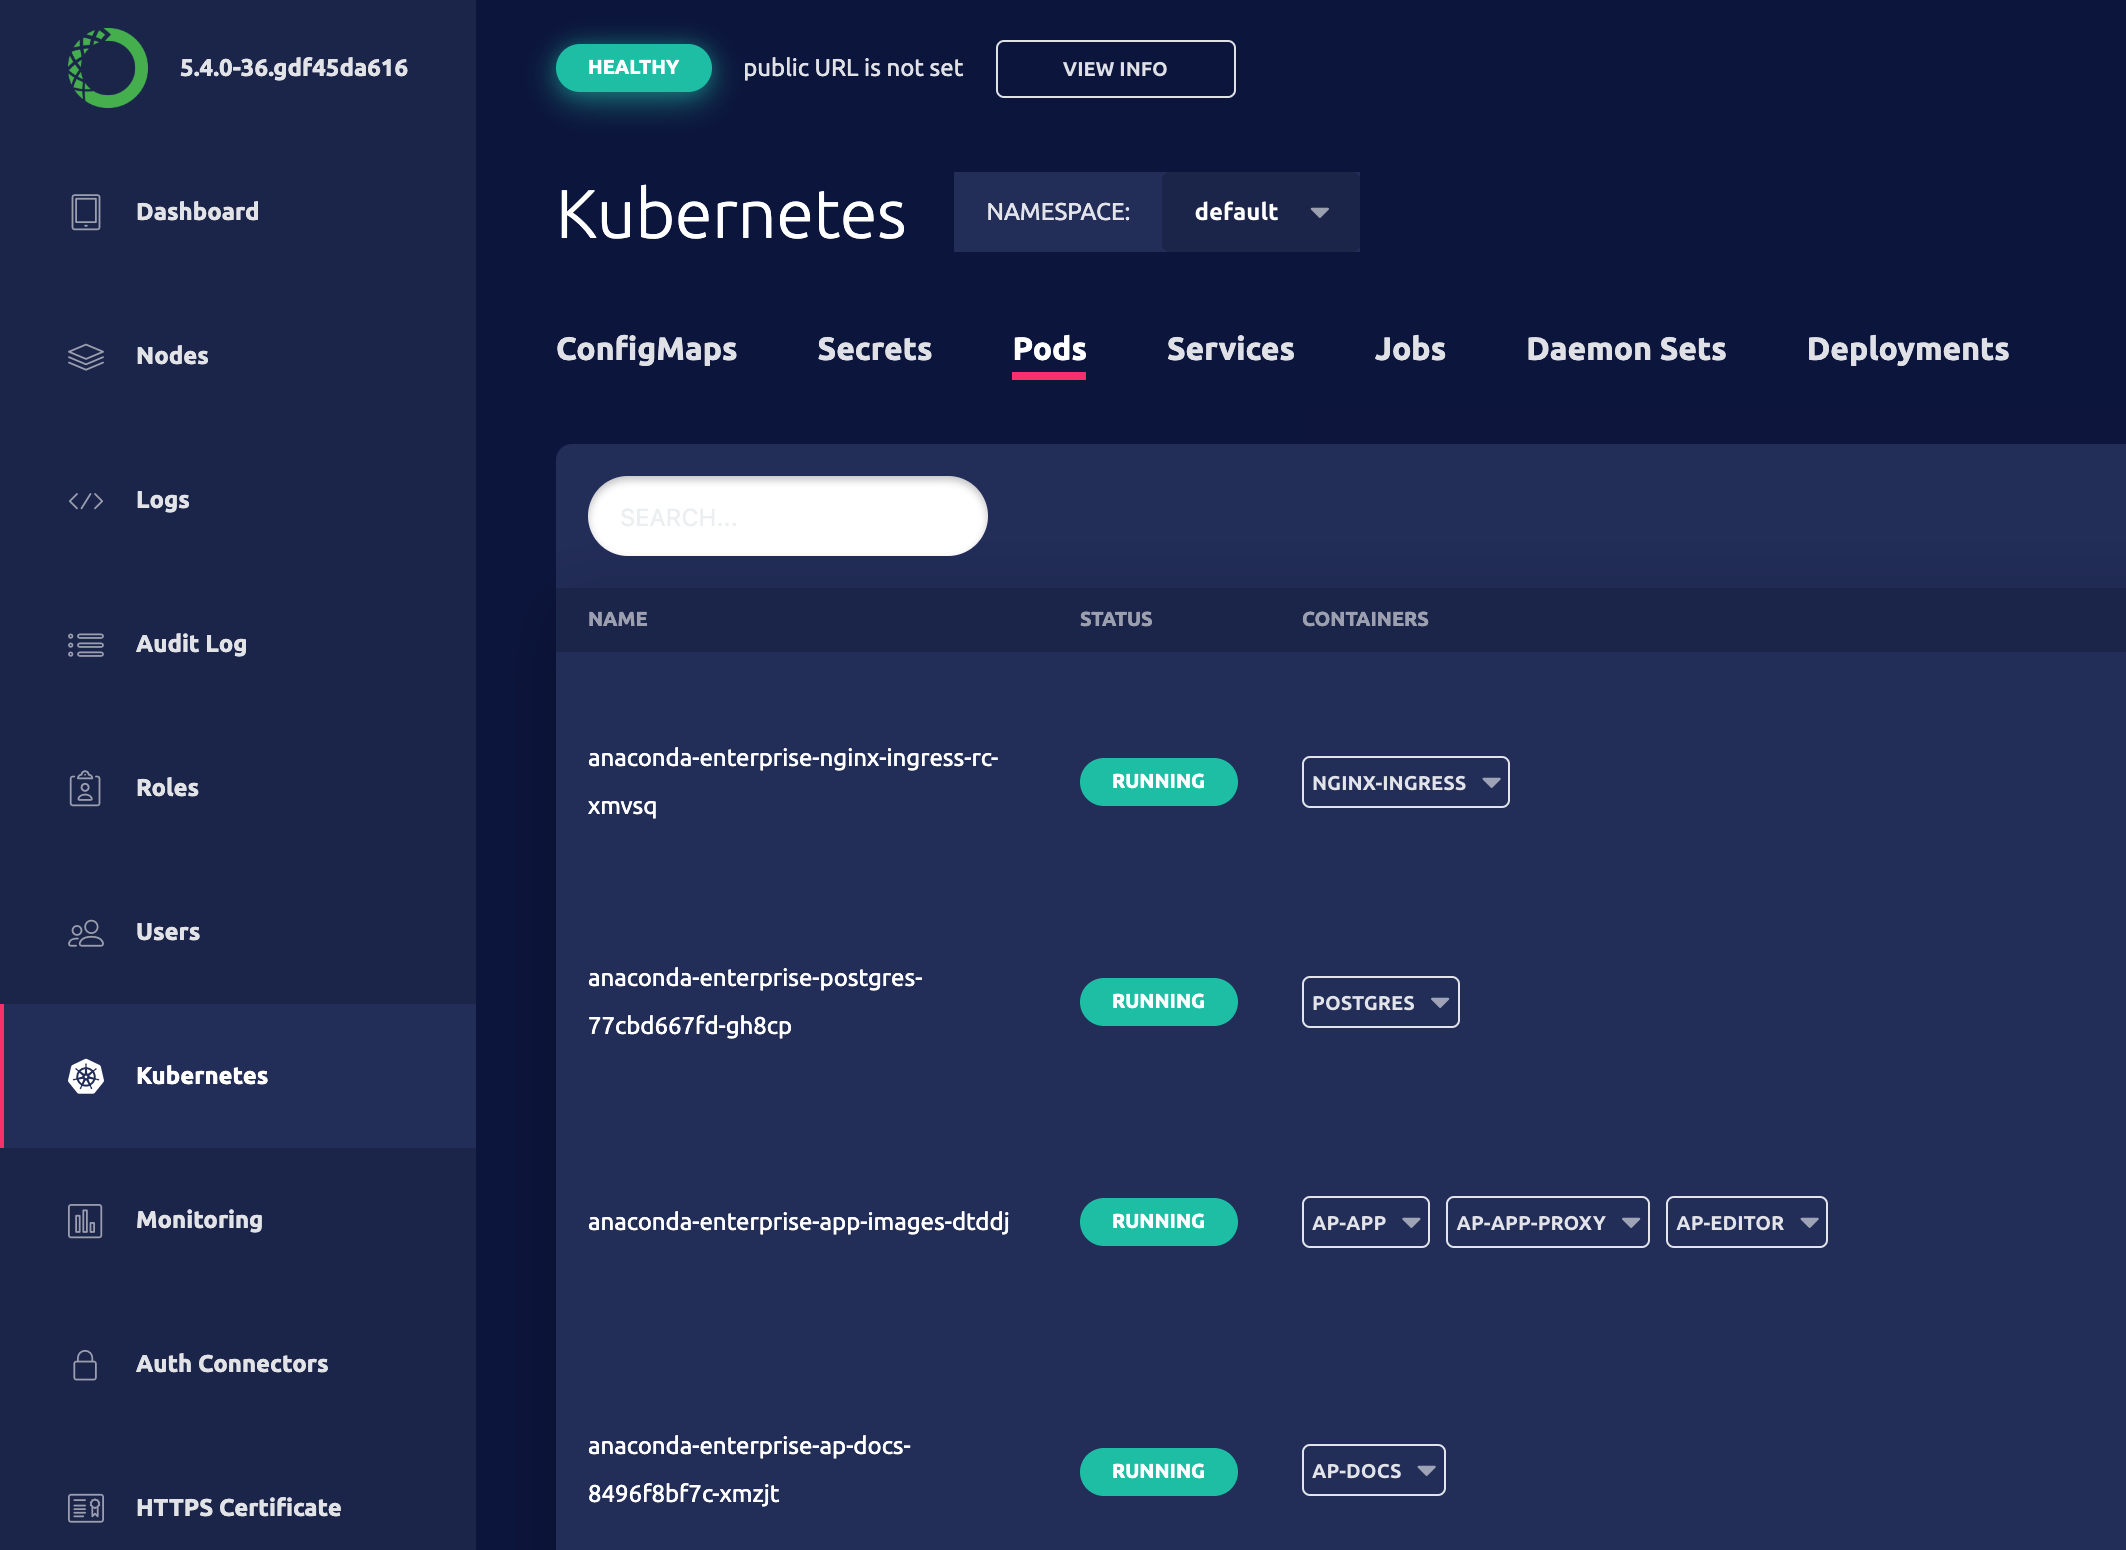
Monitoring Kubernetes
To view the status of your Kubernetes nodes, pods, services, jobs, daemon sets and deployments from the Operations Center, click Kubernetes in the menu on the left and select Pods.