http(s)://<FQDN>:3000 in your browser, where <FQDN> is your Anaconda Server fully qualified domain name, then log in using your Anaconda Server admin credentials.
Method two:
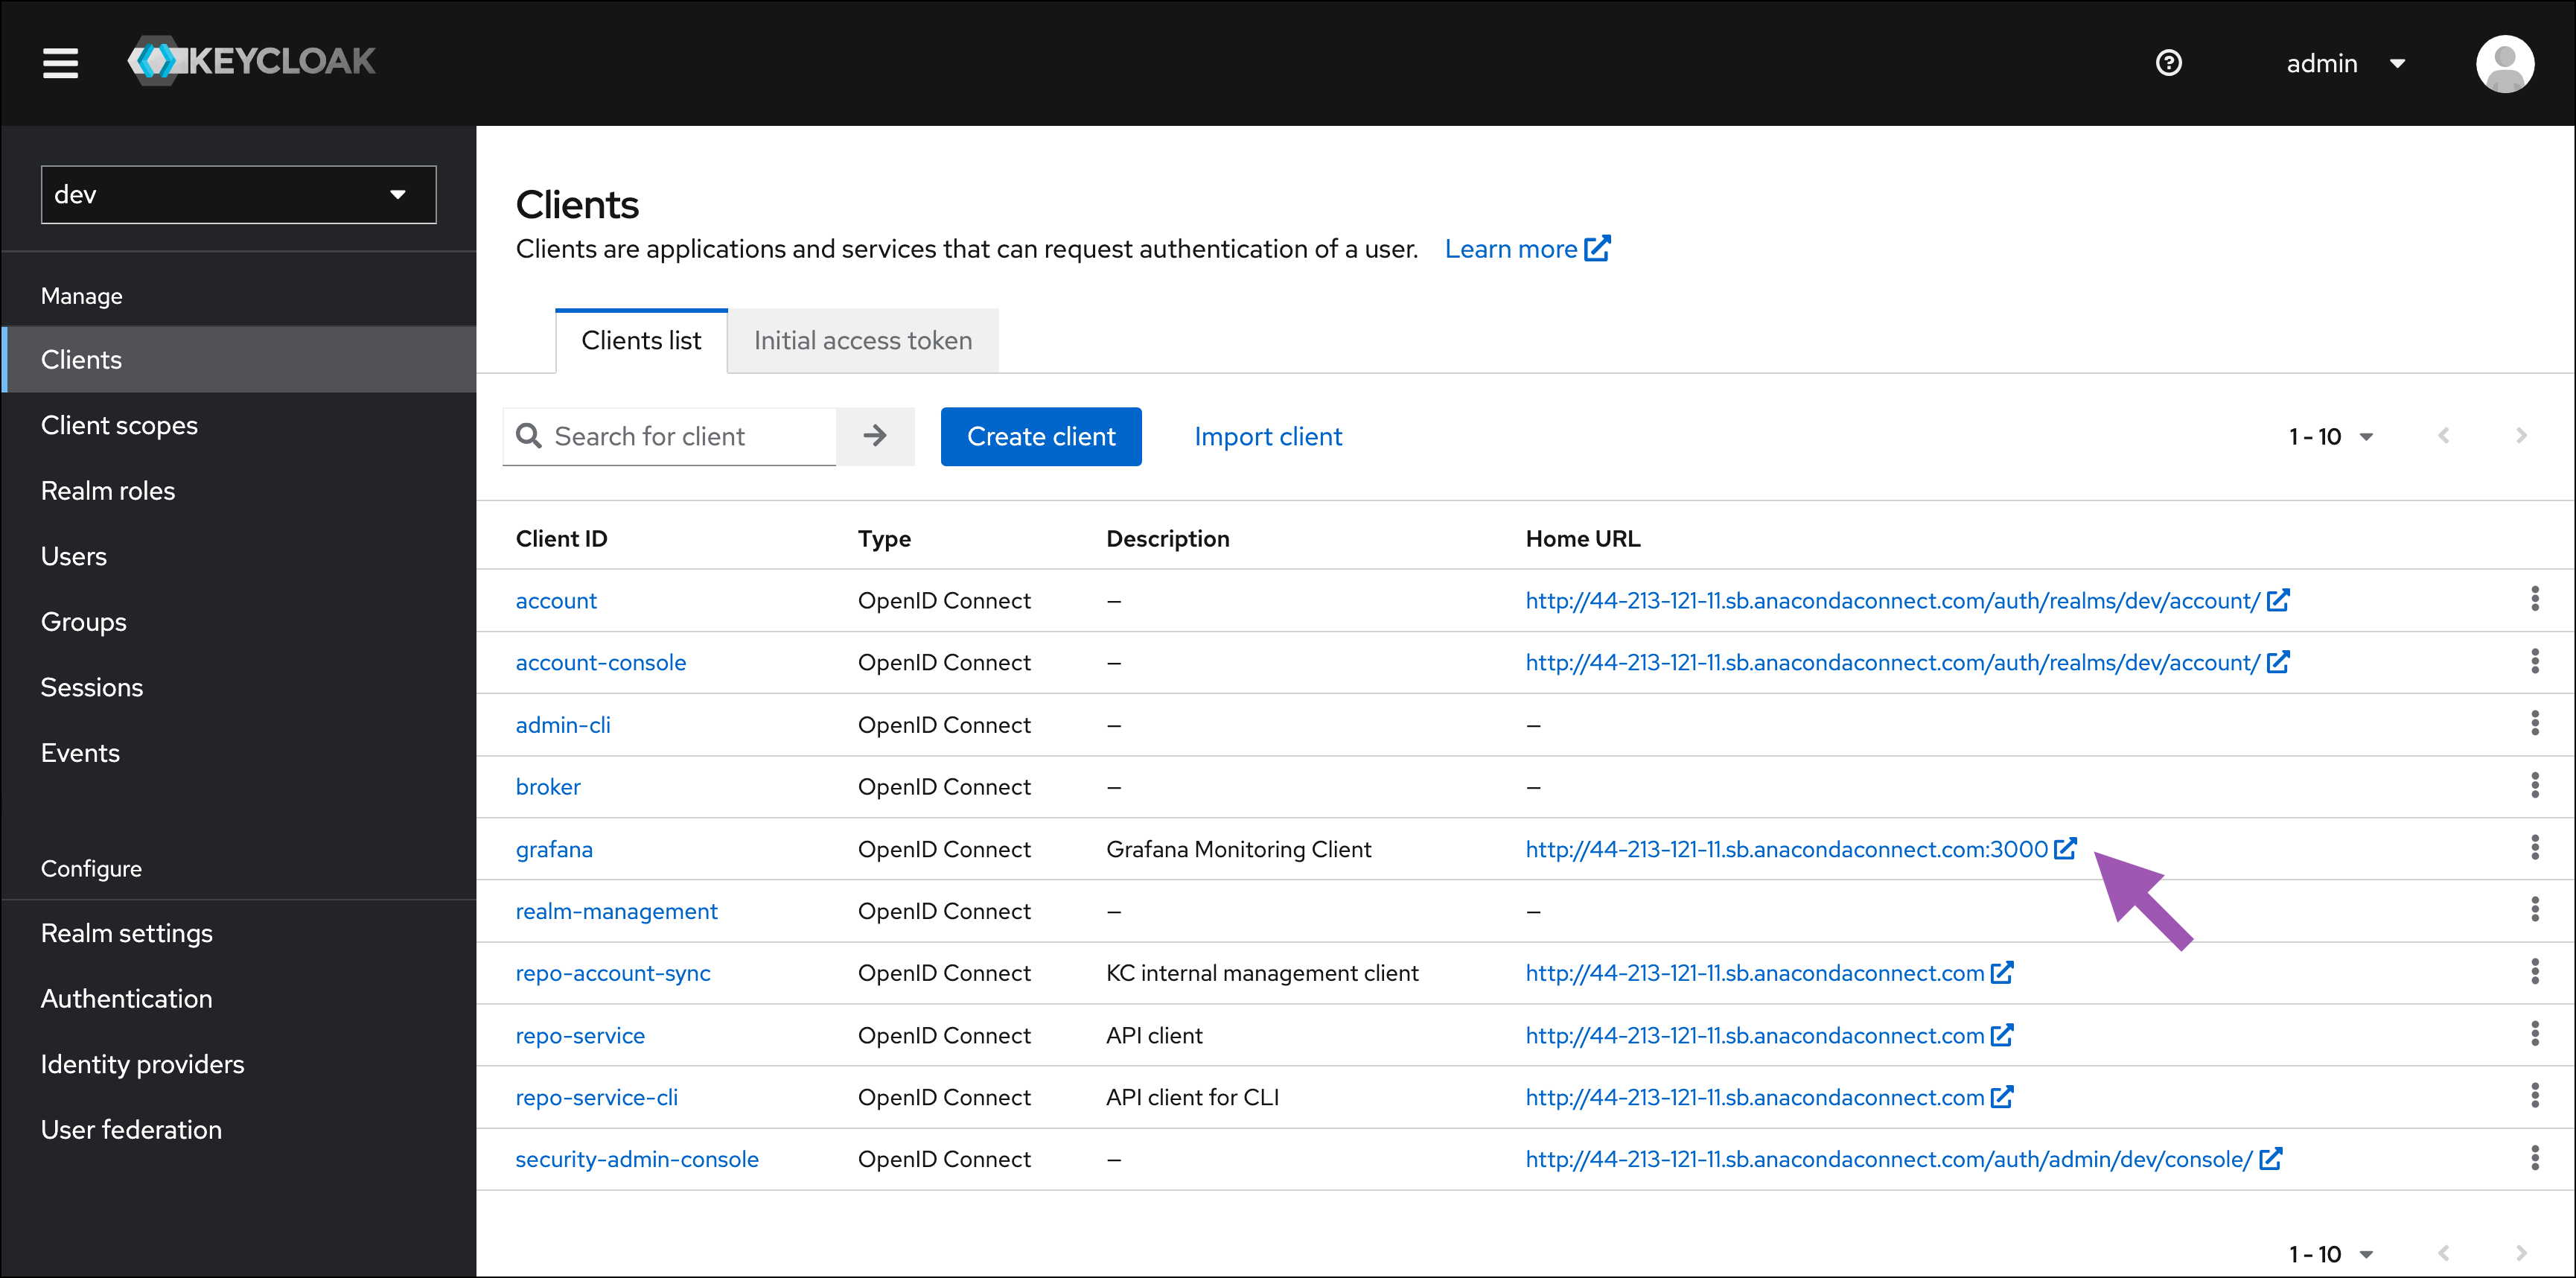
To access the Grafana dashboards via the Keycloak administrative console, complete the following steps:
- Log in to the Keycloak administrative console.
- If necessary, navigate to the Dev realm.
- Select Clients from the left-hand navigation.
-
Click the Home URL link for the grafana client.
-
If you are logging in for the first time, use admin for both the username and password, set a new Grafana password, and then click Submit.

Upgrading will reset your Grafana username and password back to admin. You must update this password after upgrading Anaconda Server.