- Log in to Workbench, select Menu in the top right corner and click the Administrative Console link displayed at the bottom of the slide out window.
- Click Manage Resources.
- Log in to the Operations Center using the Administrator credentials configured after installation.
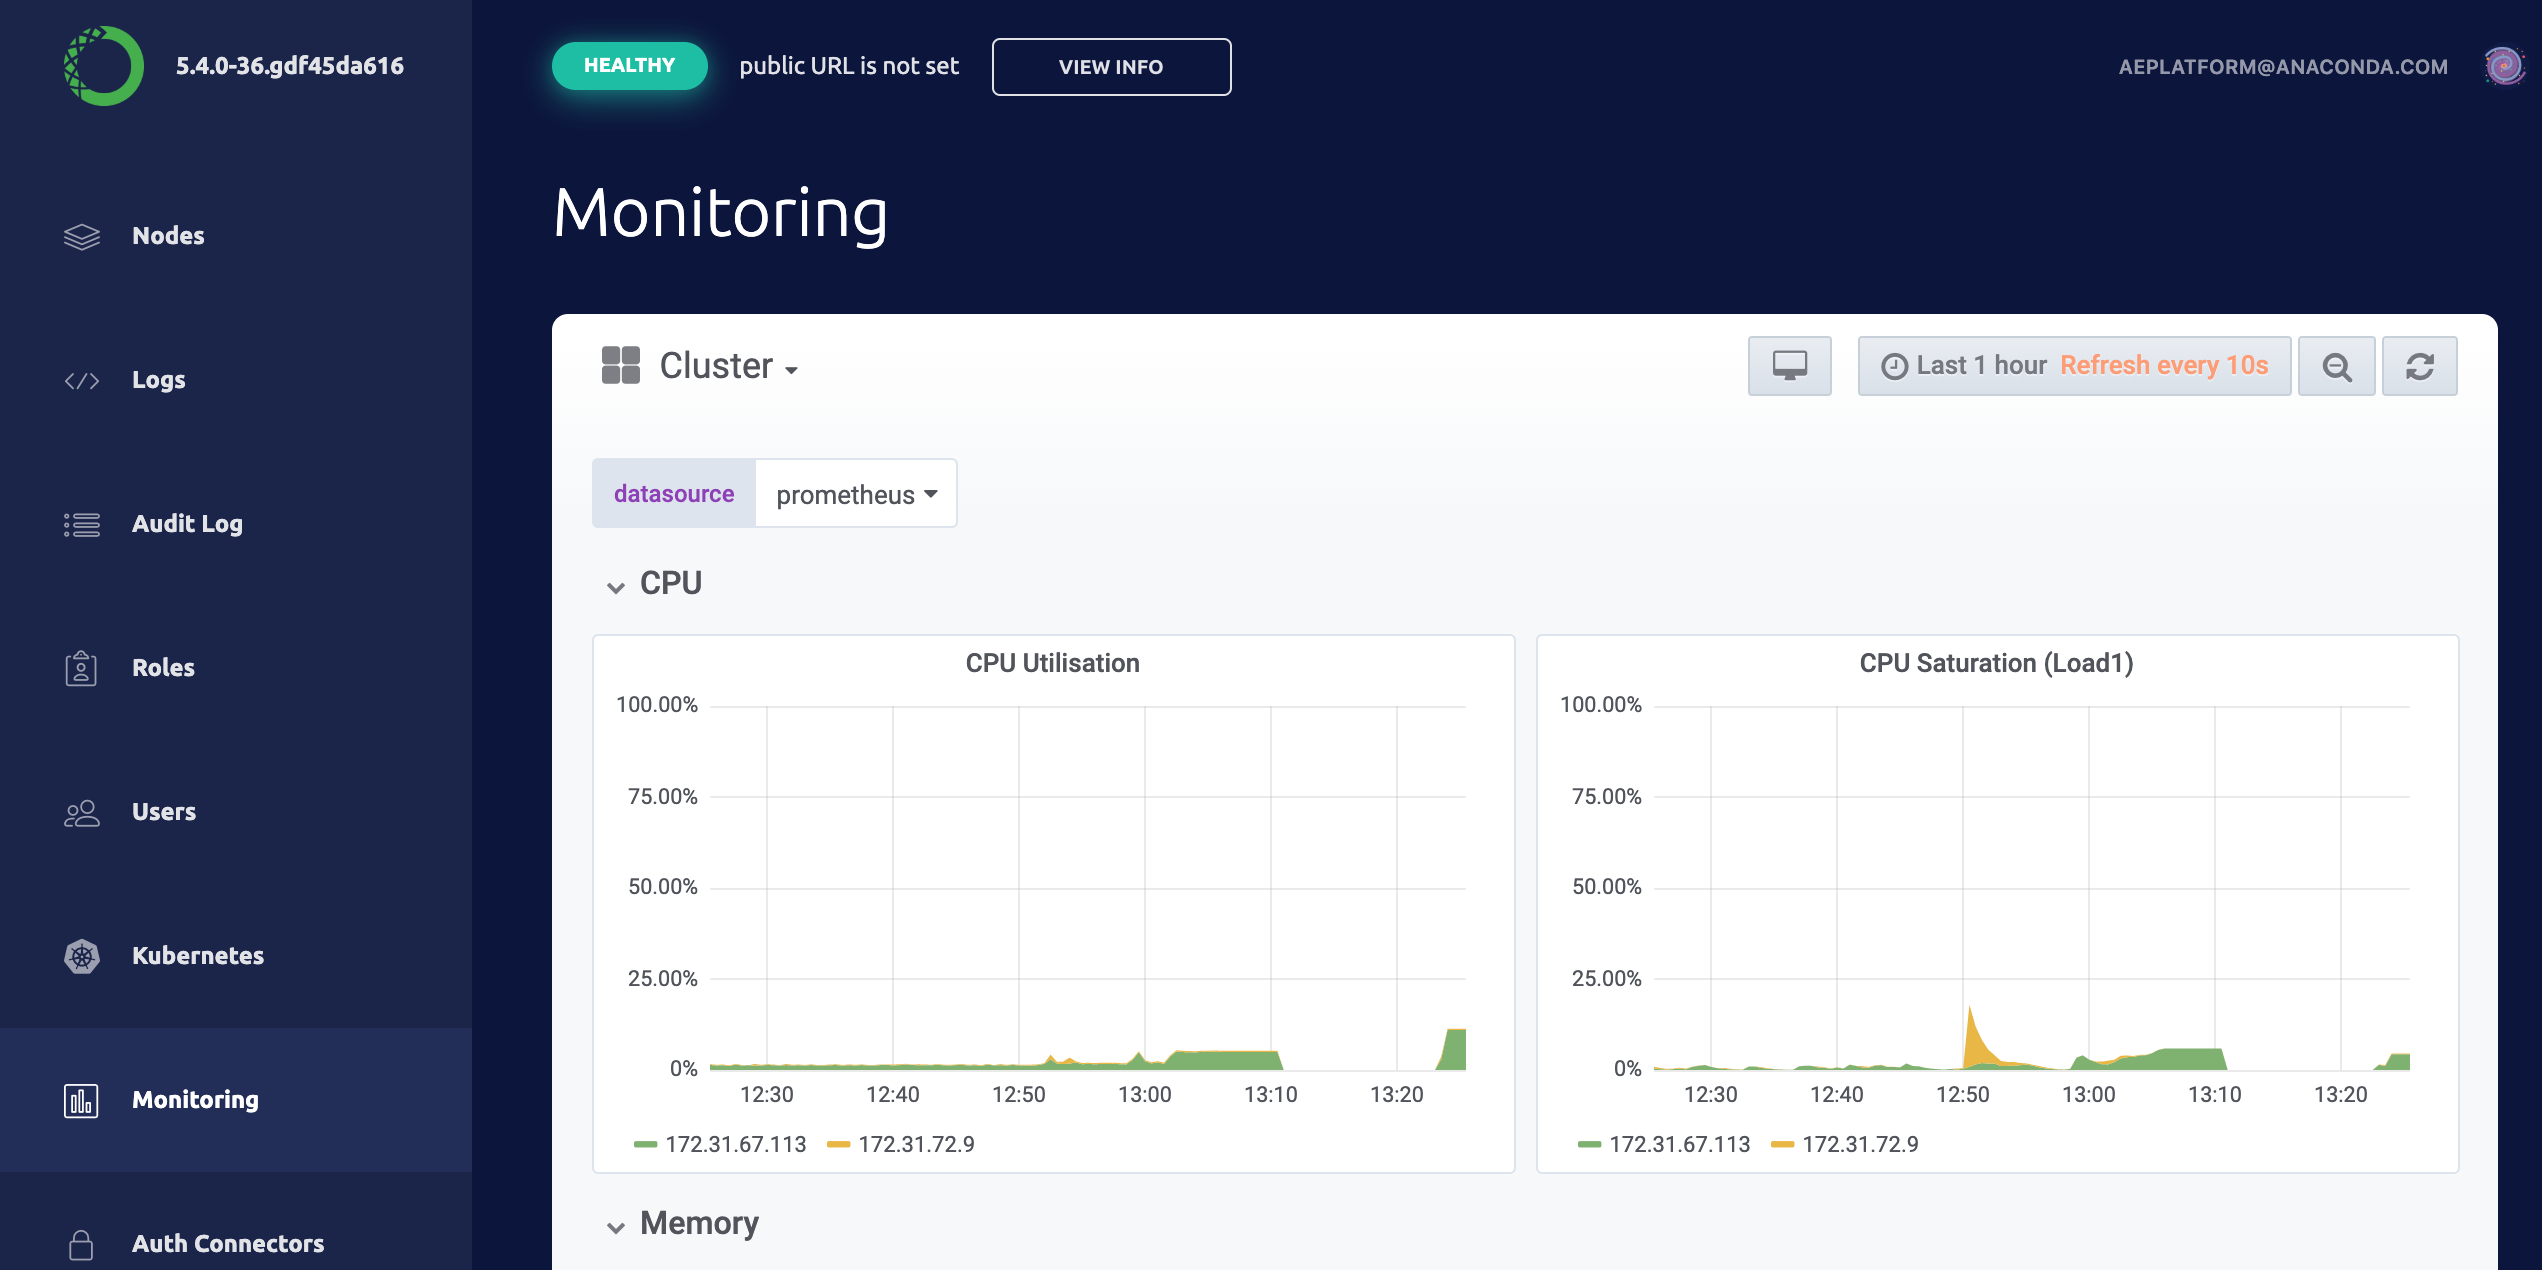
- Select Monitoring from the menu on the left to display the monitoring dashboards.
Individual pod
To display the monitoring graph for a user session or deployment you’ll need to identify the appropriate Kubernetes pod name. For an editor session the Kubernetes pod name corresponds to the hostname of the session container. Runhostname in a terminal window. For deployments the pod name is available from the logs tab of the deployment under the heading name.
- Click the Monitoring tab from the menu on the left
- Click Cluster at the top left of the dashboard
- Select Compute Resource / Workload
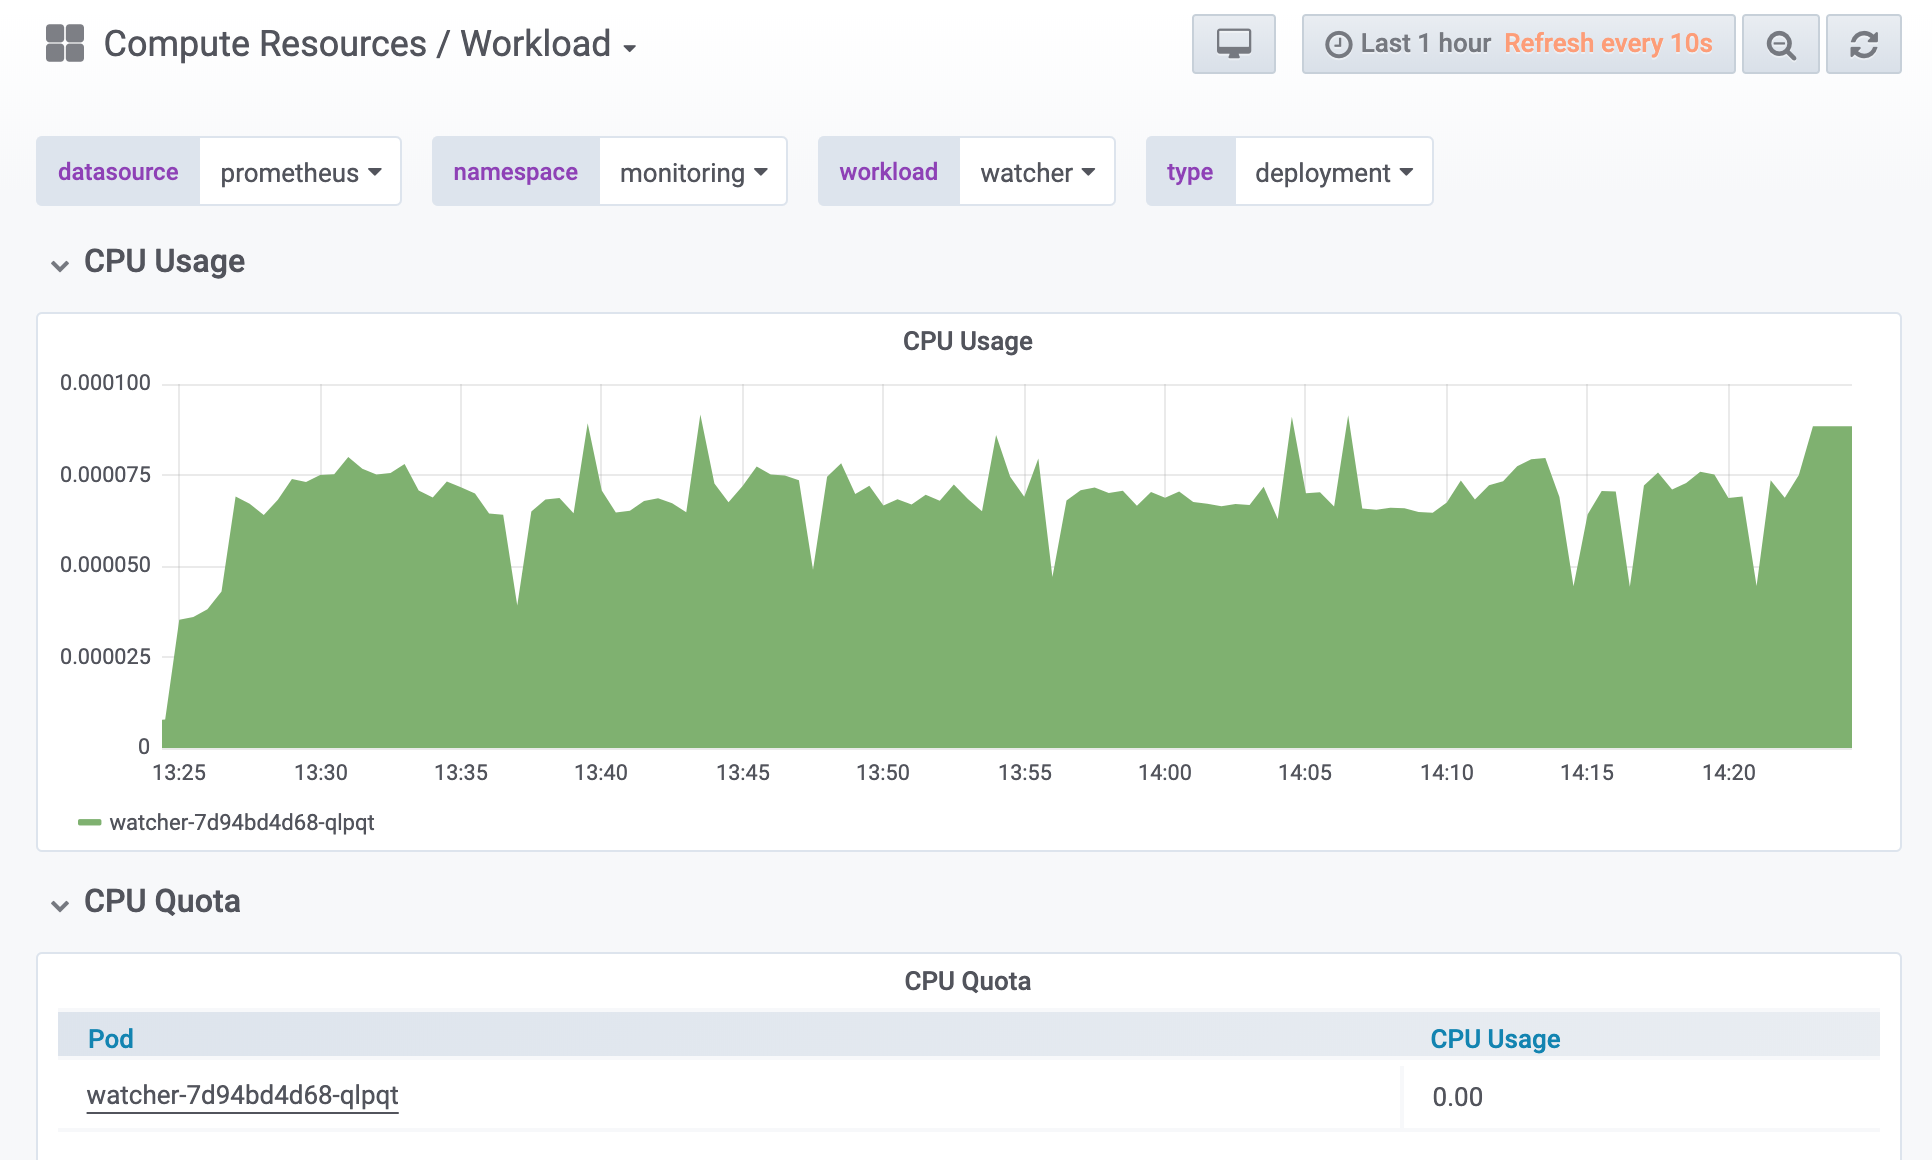
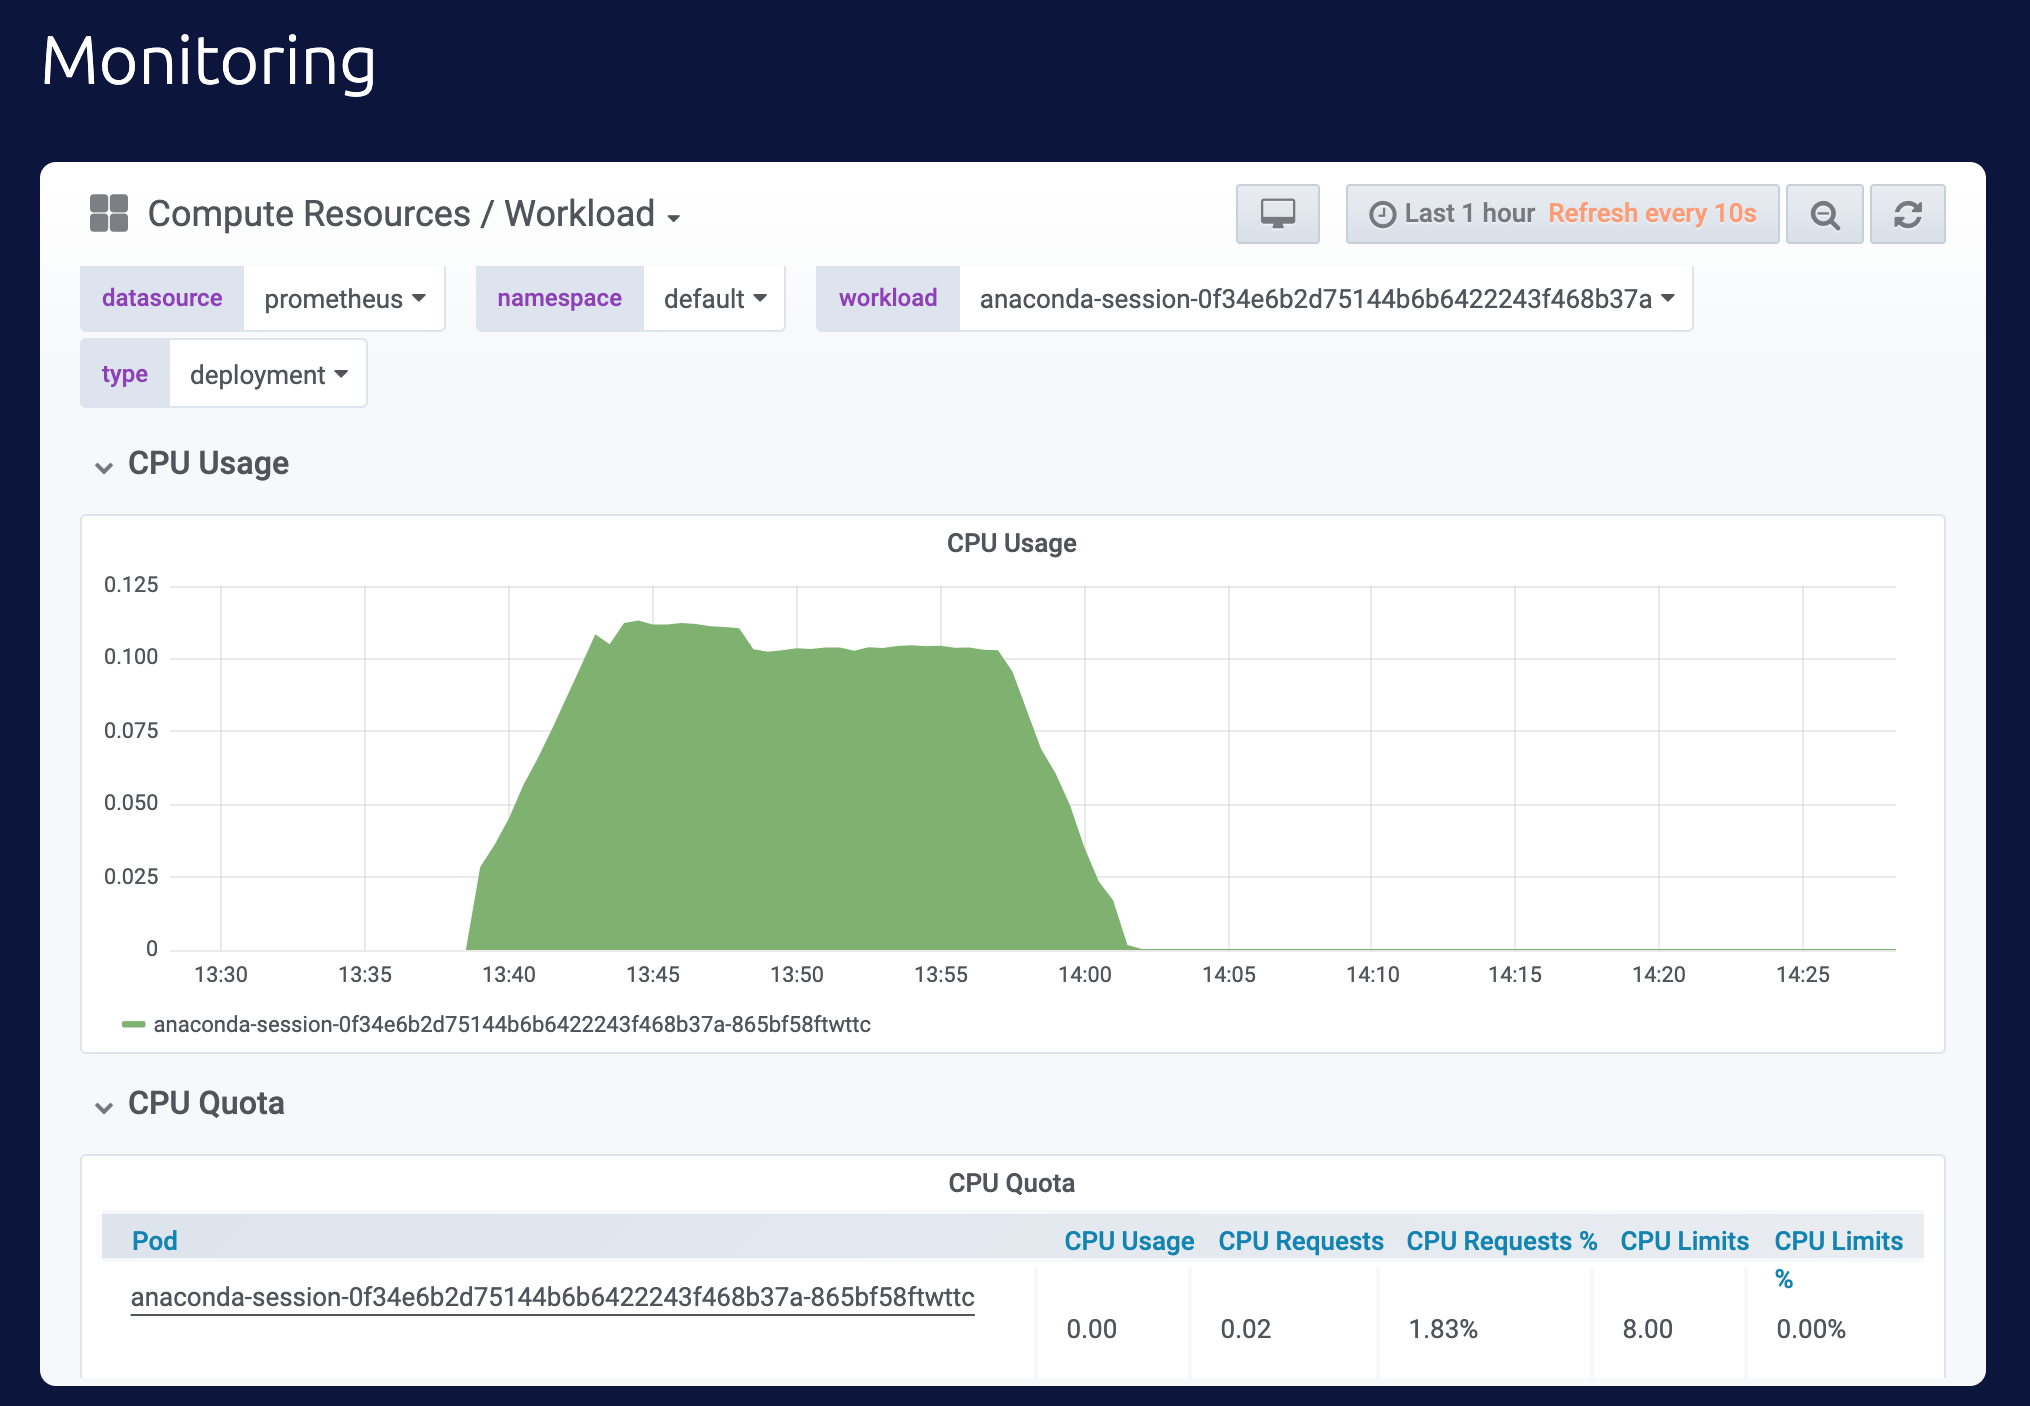
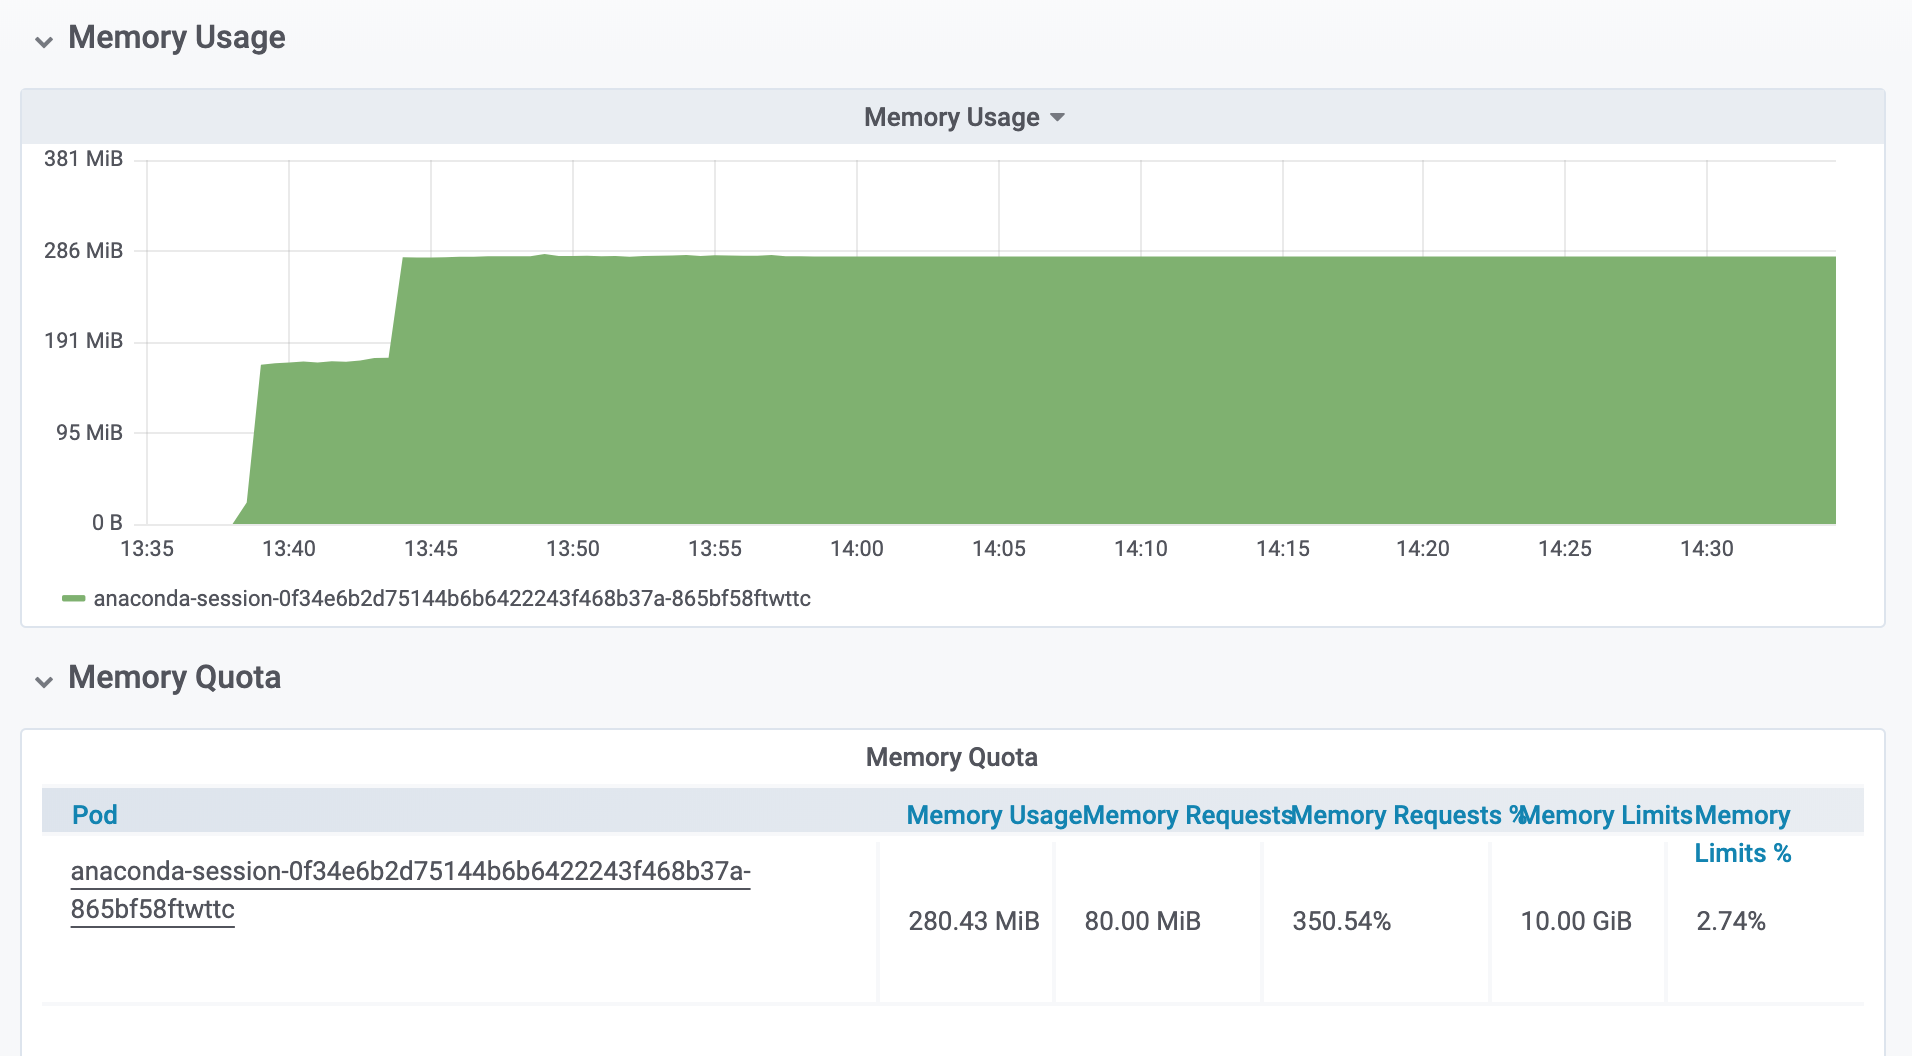
- Select
defaultfrom the namespace menu - Select the preferred pod from the the workload menu
- Open an SSH session on the master node in a terminal by logging into the Operations Center and selecting Servers from the menu on the left.
- Click on the IP address for the Workbench master node and select SSH login as root.
- In the terminal window, run
sudo gravity enter.