Follow these steps to create an interactive plot:
- From the Projects view, select Create + > New Project and create a project from the
Anaconda 3.6 (v5.0.1)template:
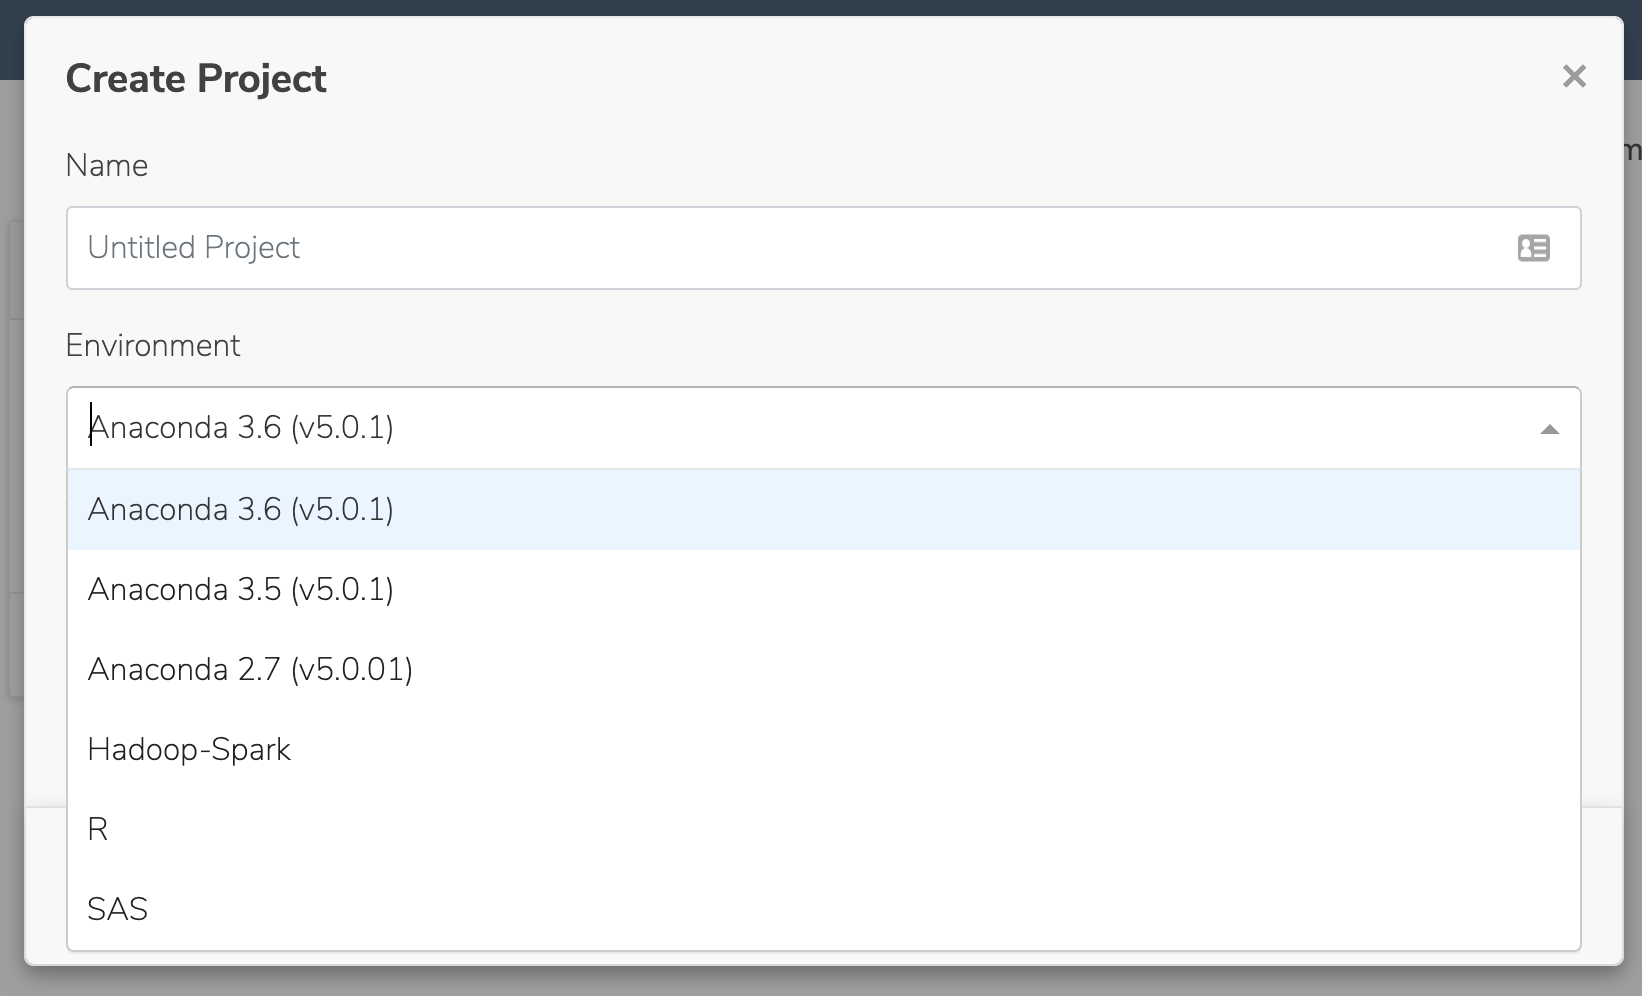
-
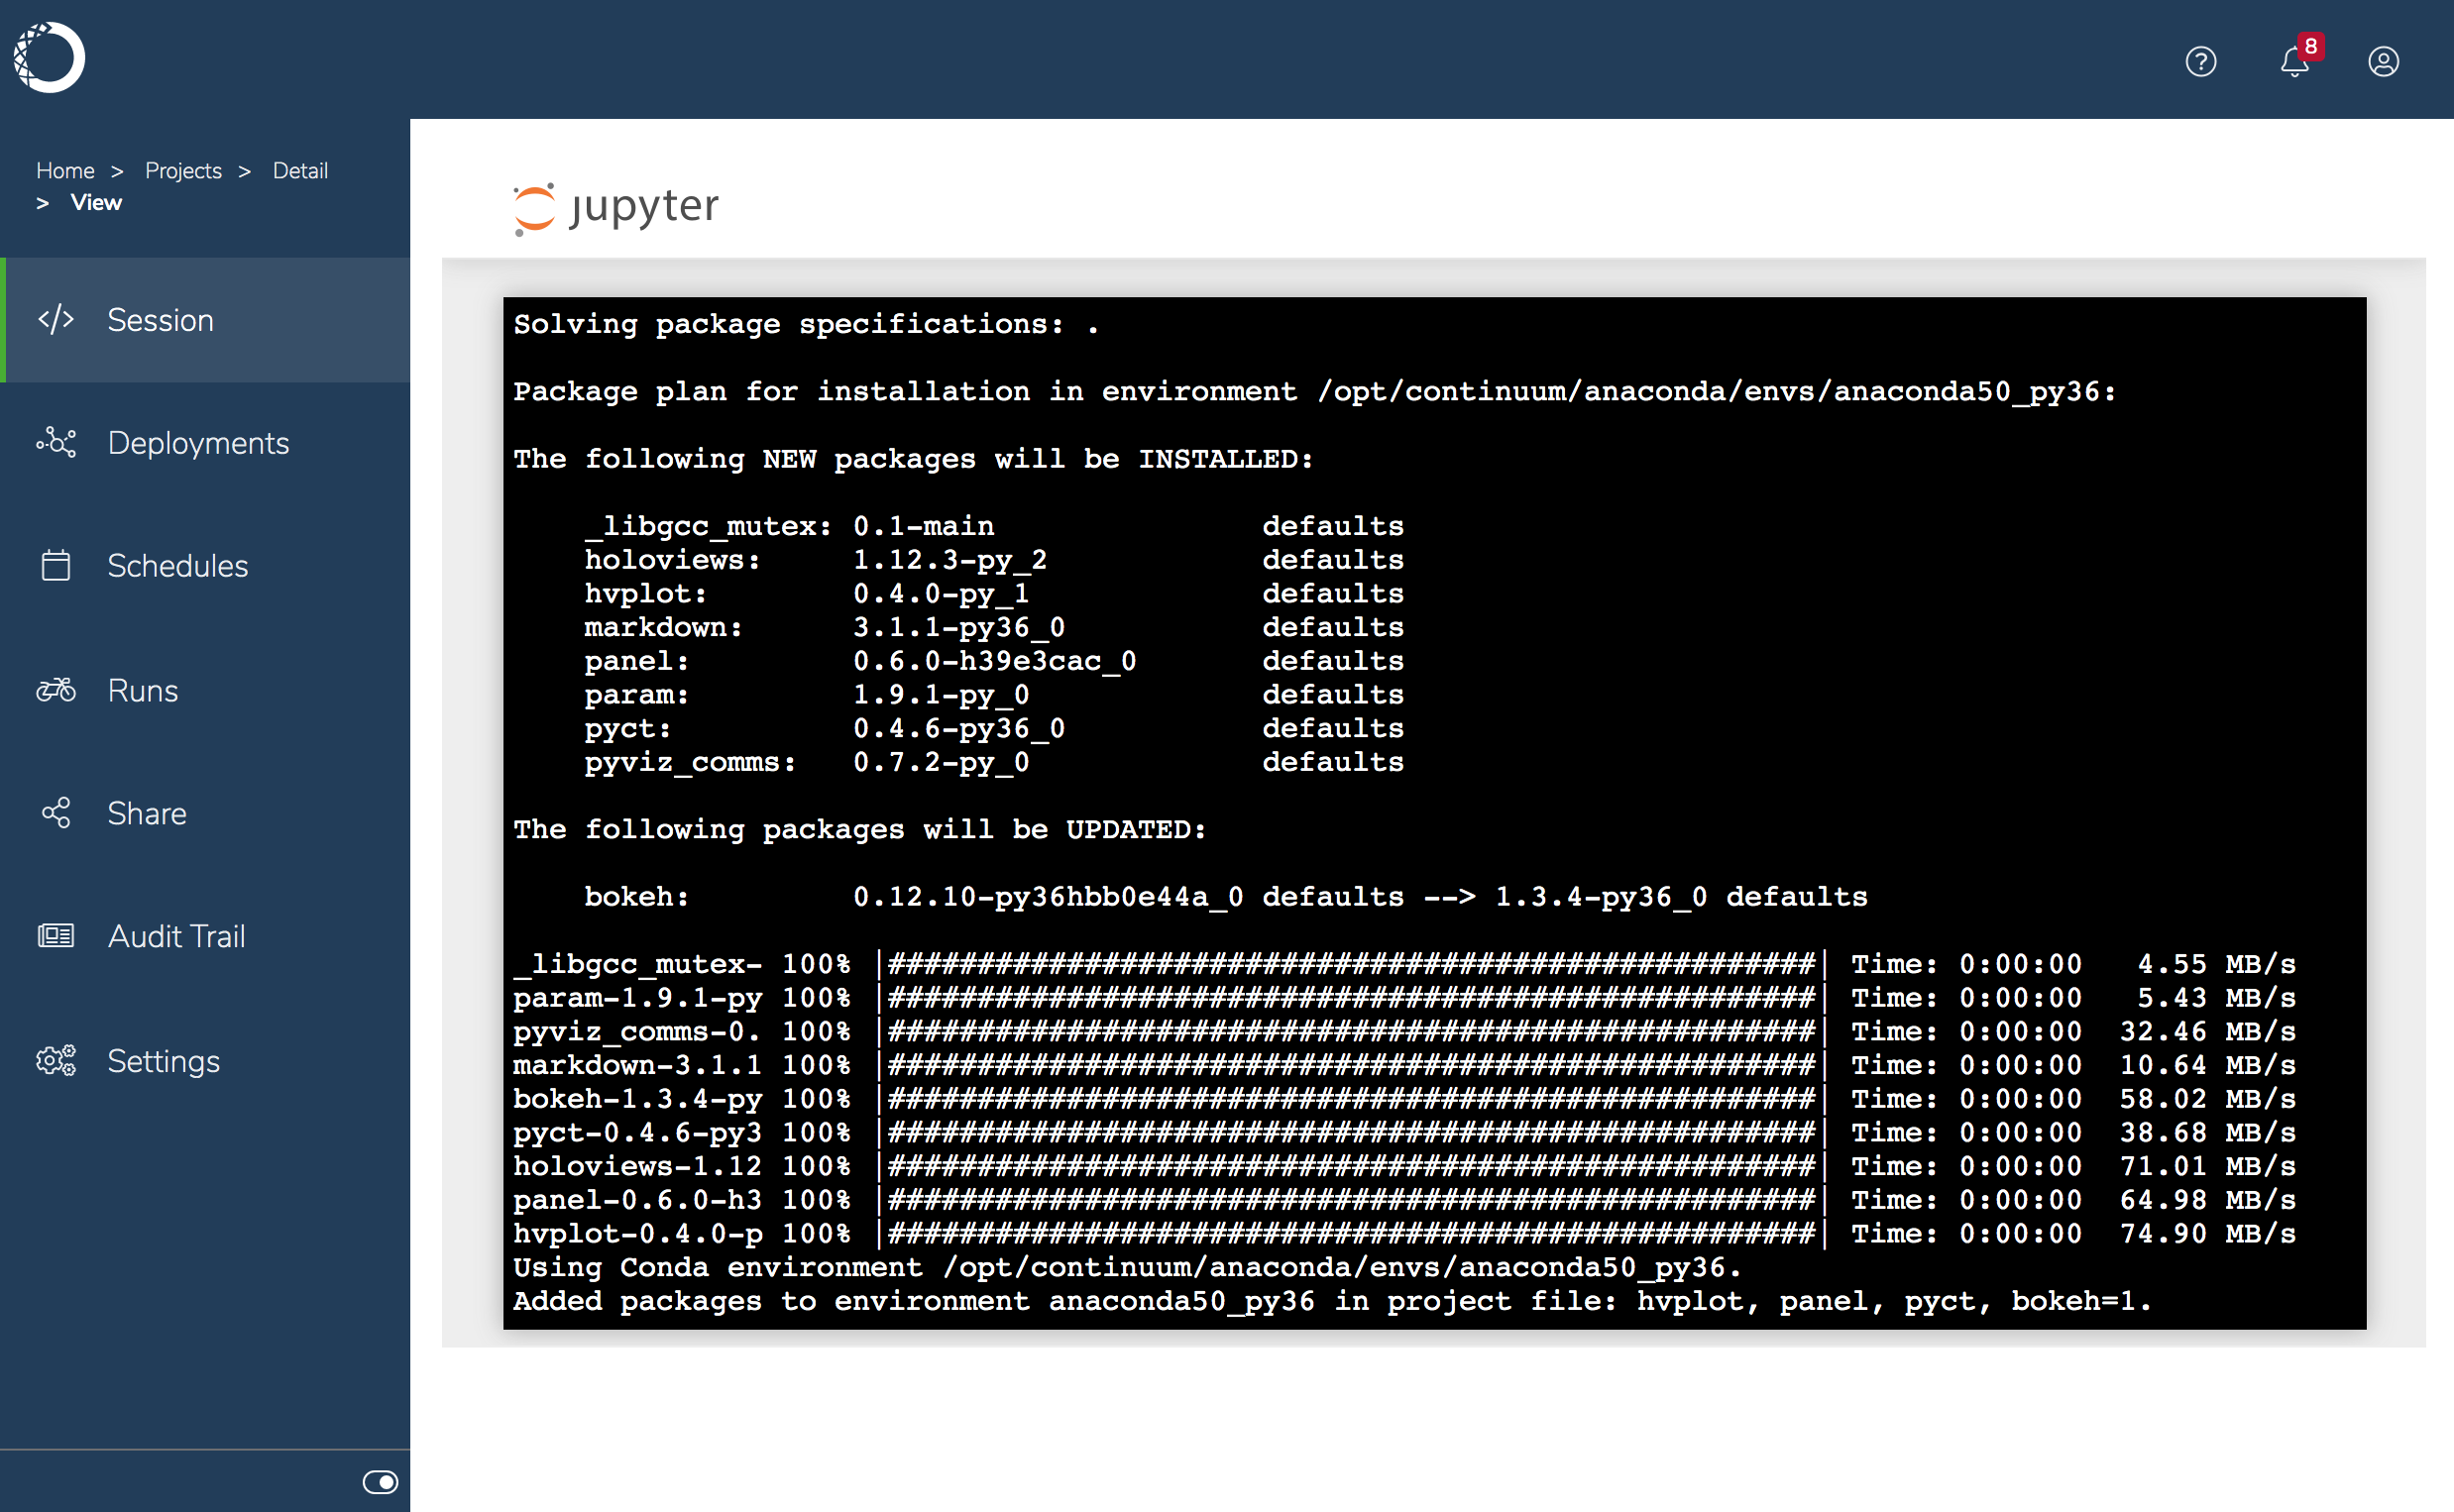
Open the project in a session, select New > Terminal to open a terminal, and run the following command to install packages for
hvplot,panel,pyct, andbokeh:
- Select New > Python 3 to create a new notebook, rename it
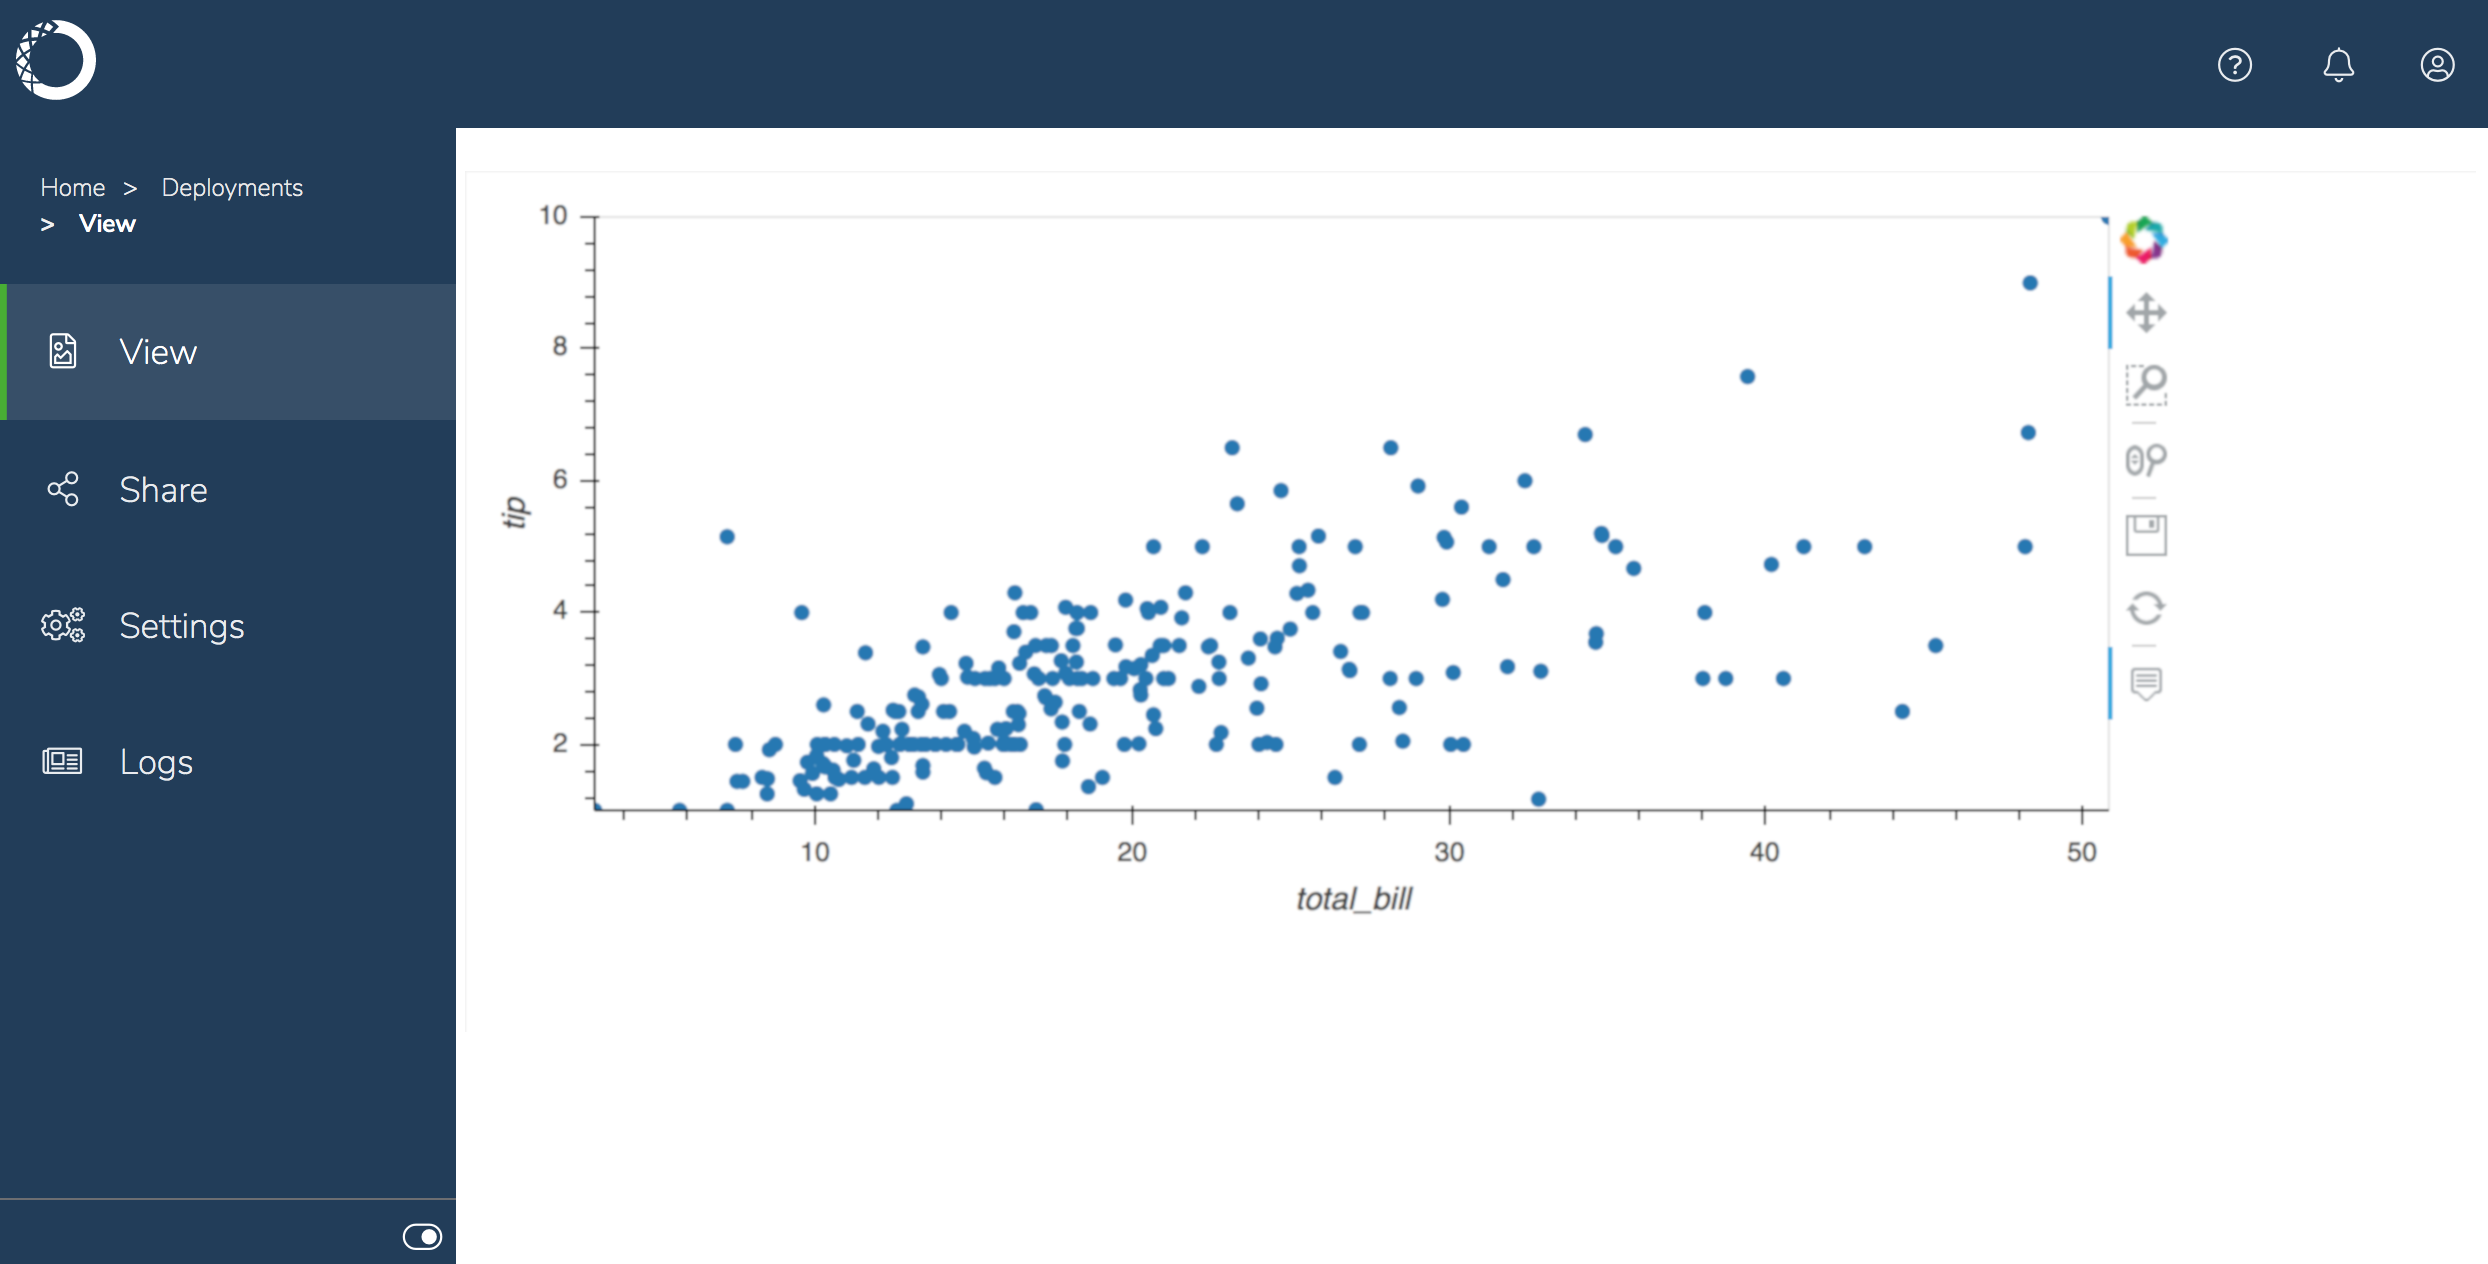
tips.ipynb, and add the following code to create an interactive plot:
In this example, the data is being read from the Internet. Alternatively, you could download the
.csv and upload it to the project.- Open the project’s
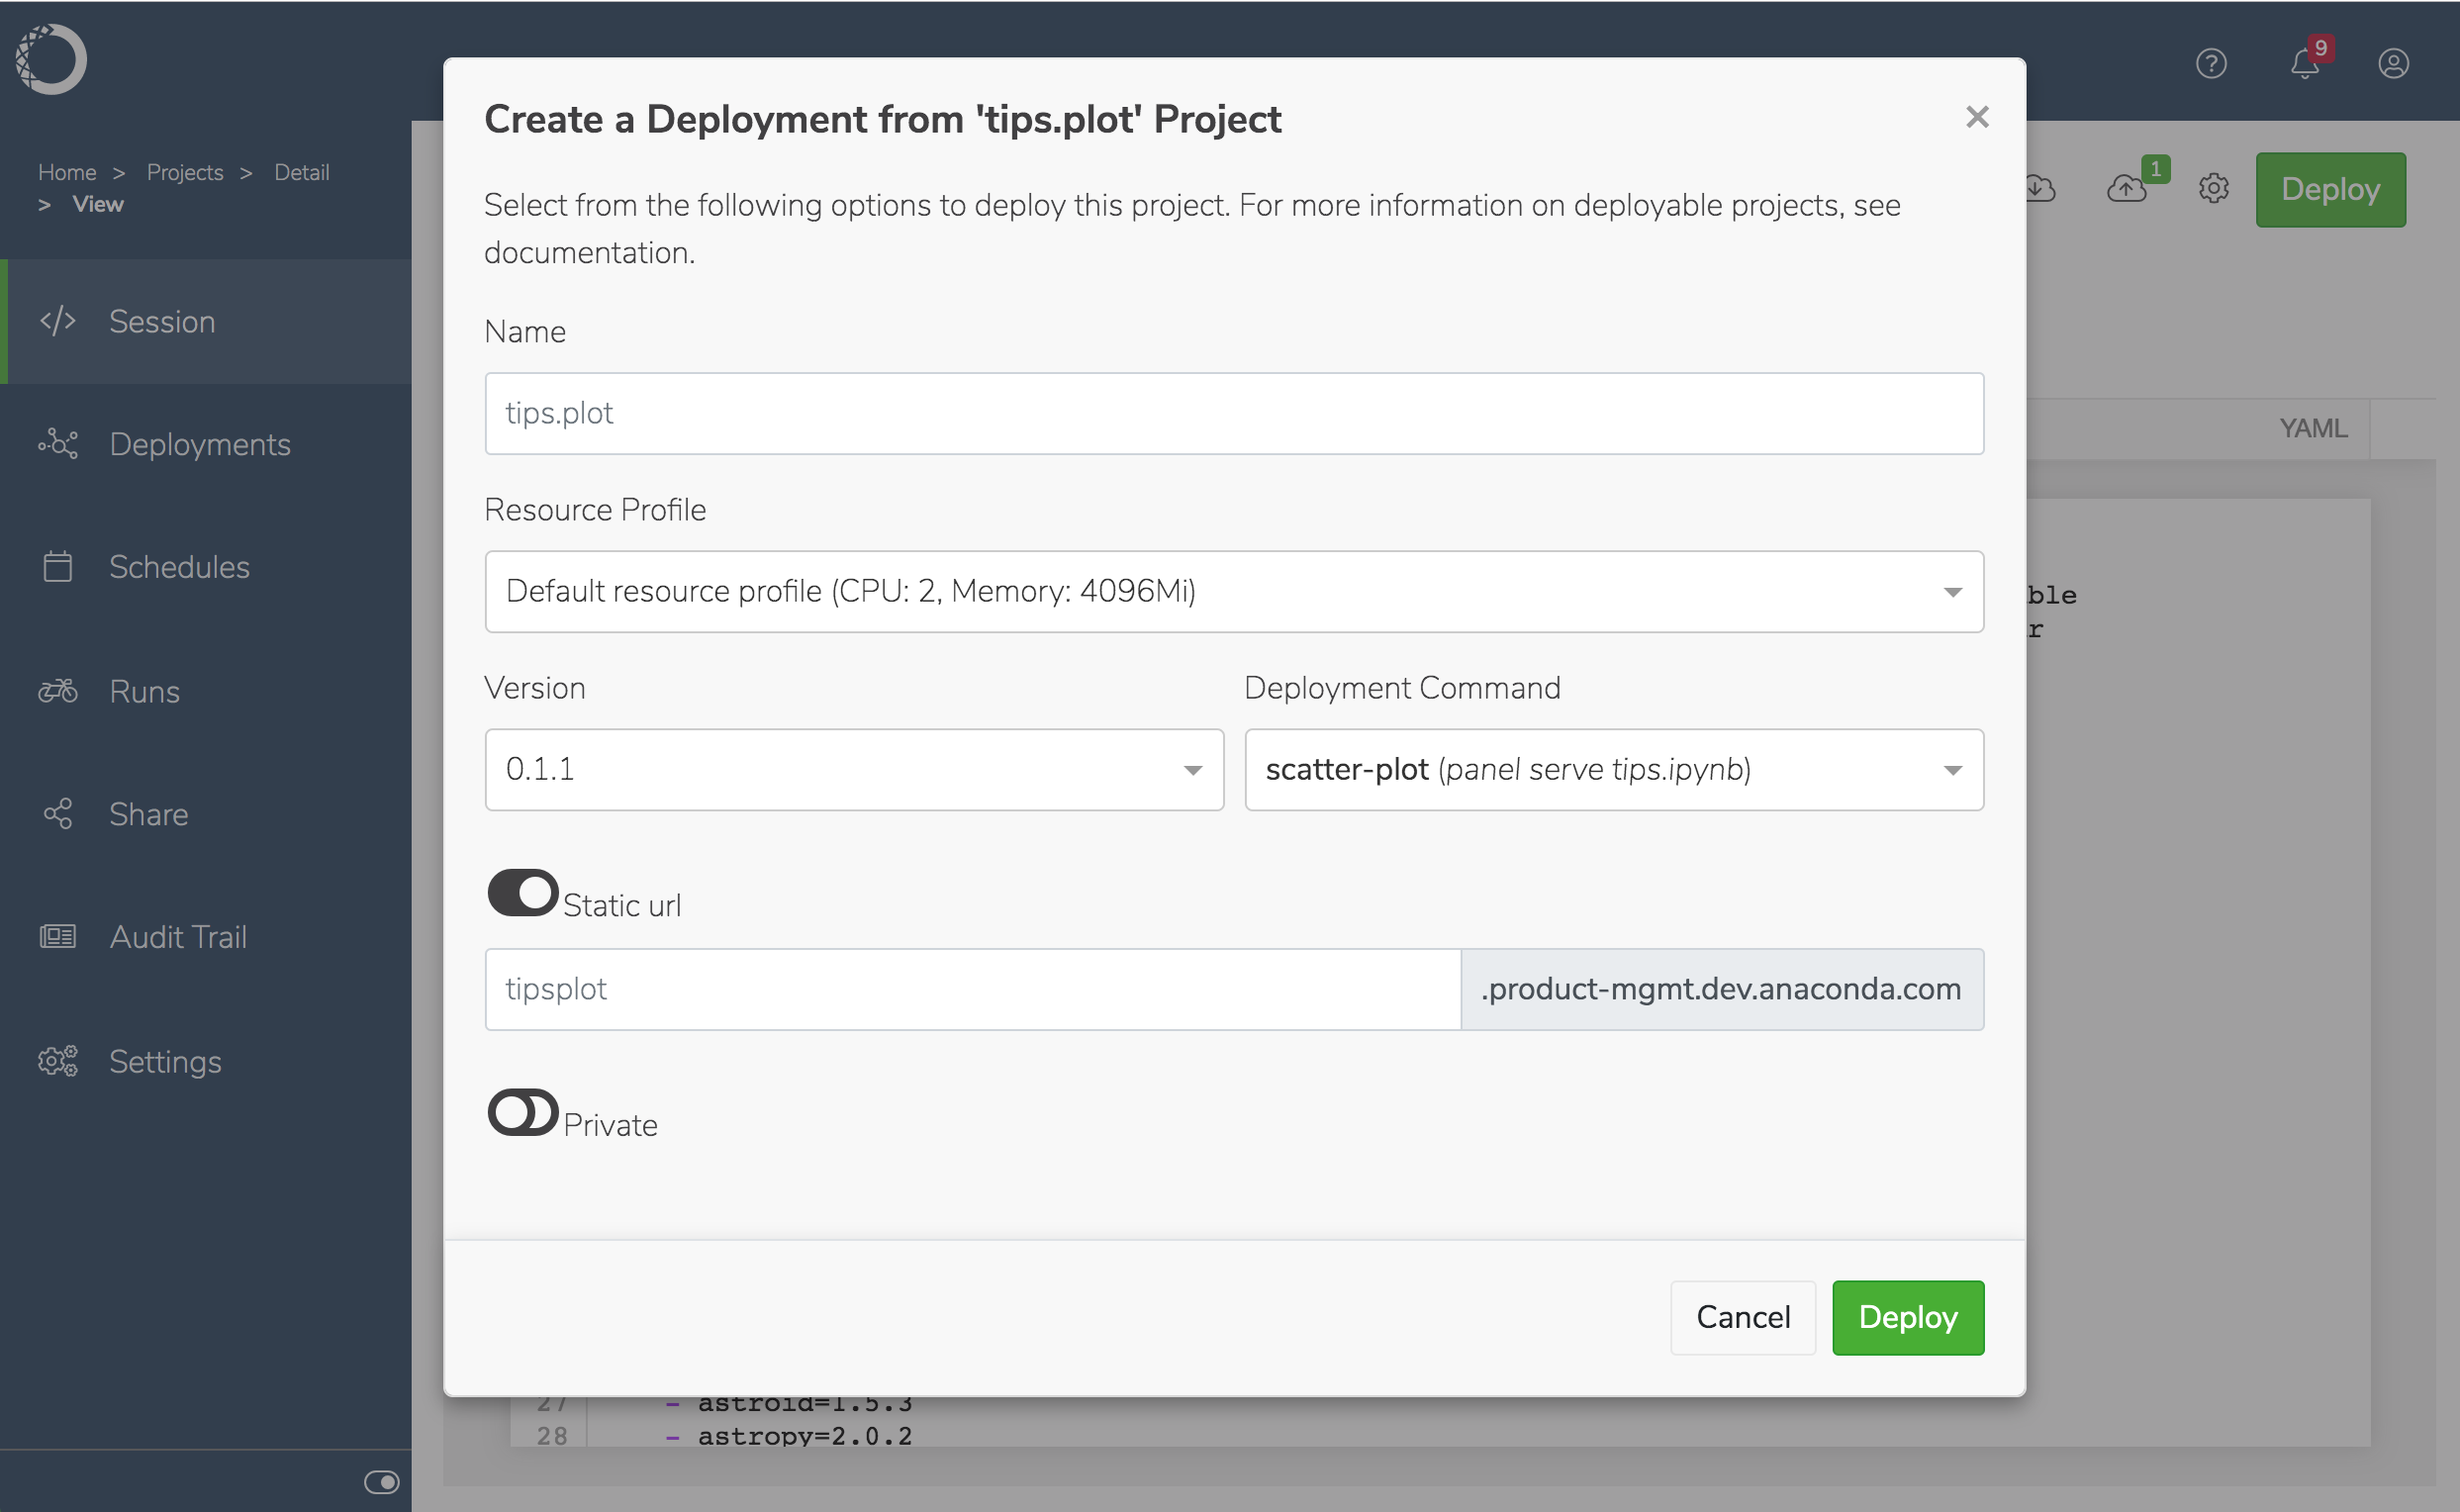
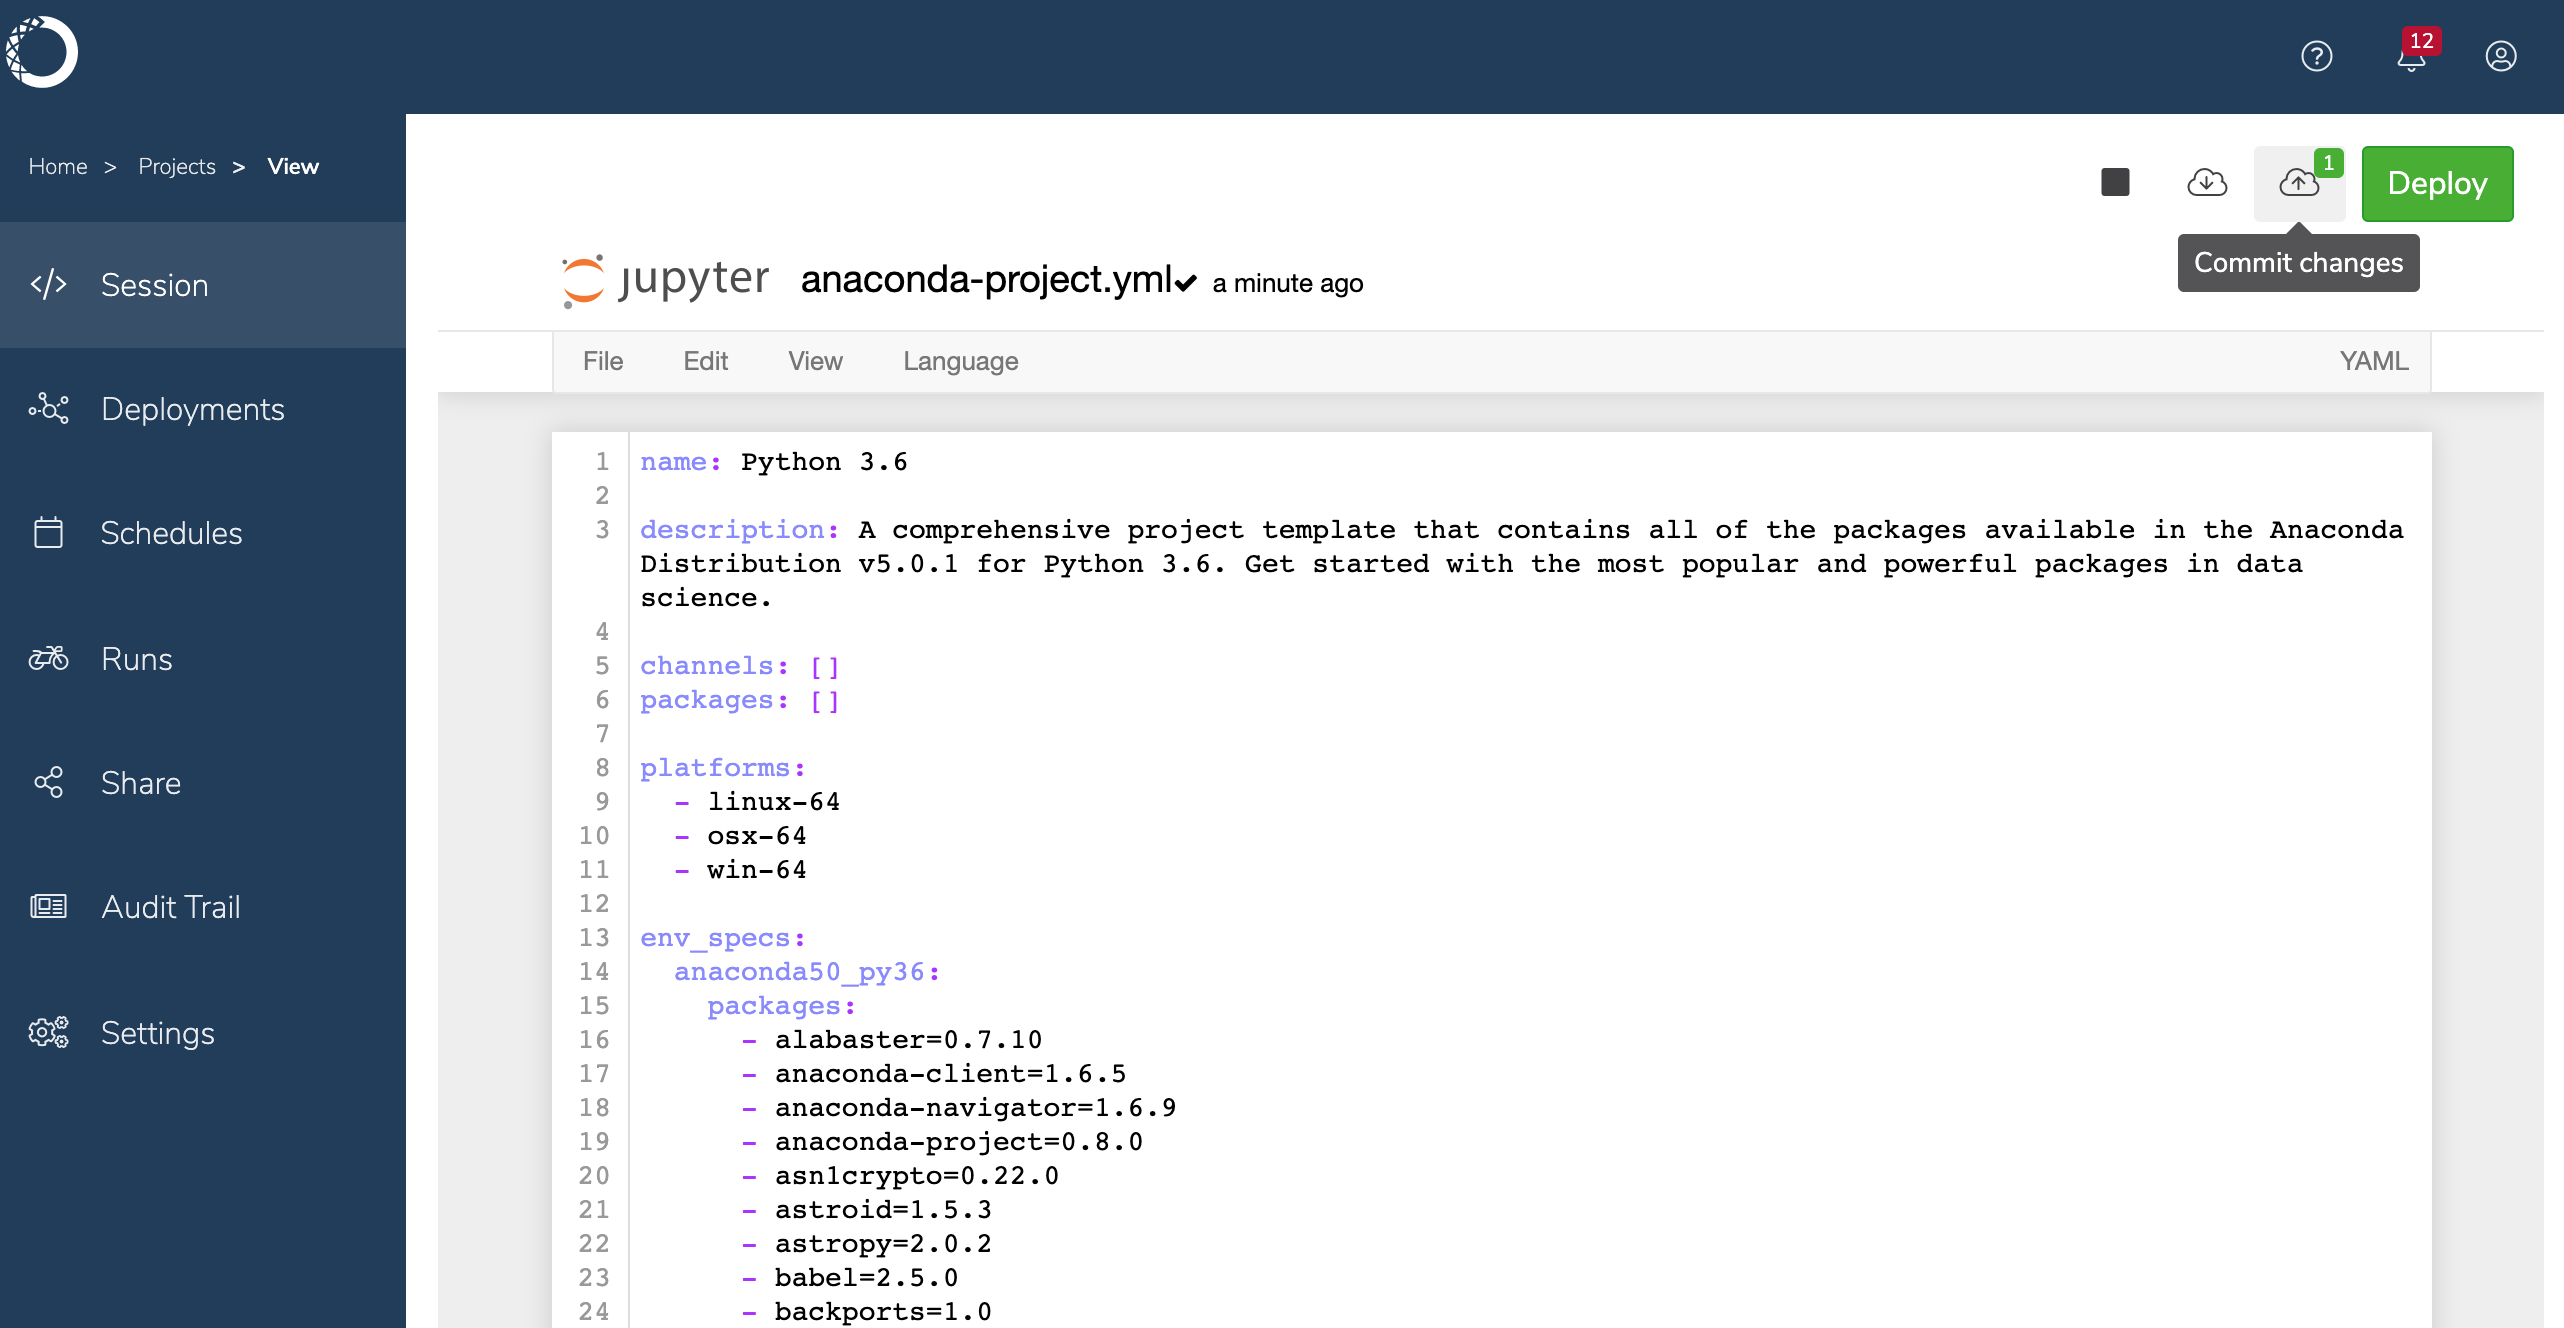
anaconda-project.ymlfile, and add the following lines after thedescription. This is the deployment command that Anaconda Enterprise will use when you deploy the notebook
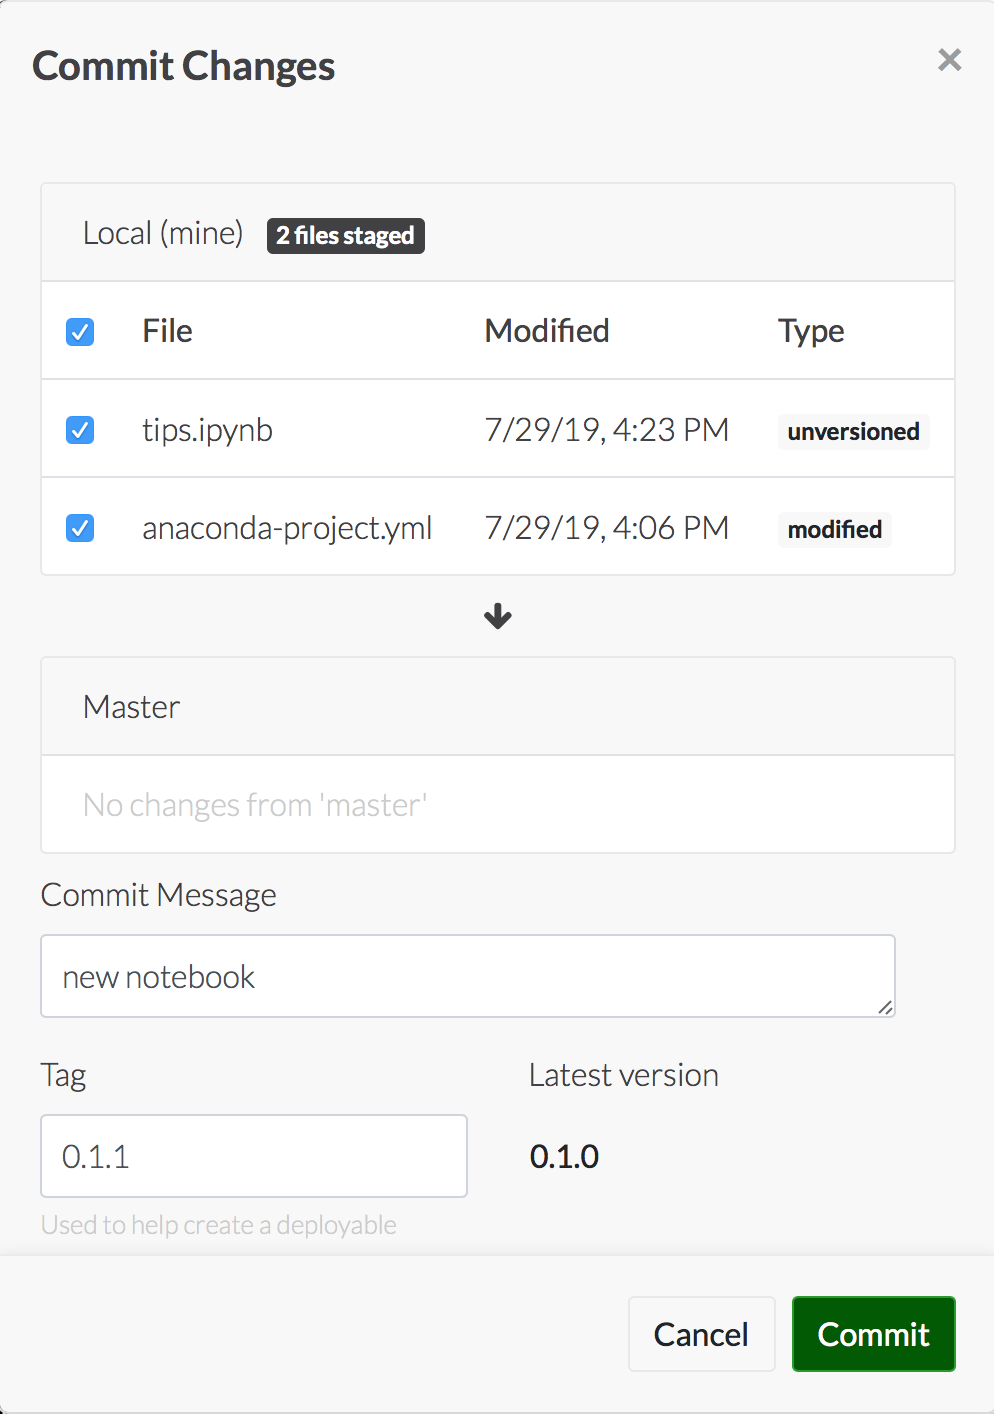
- Save and commit your changes.
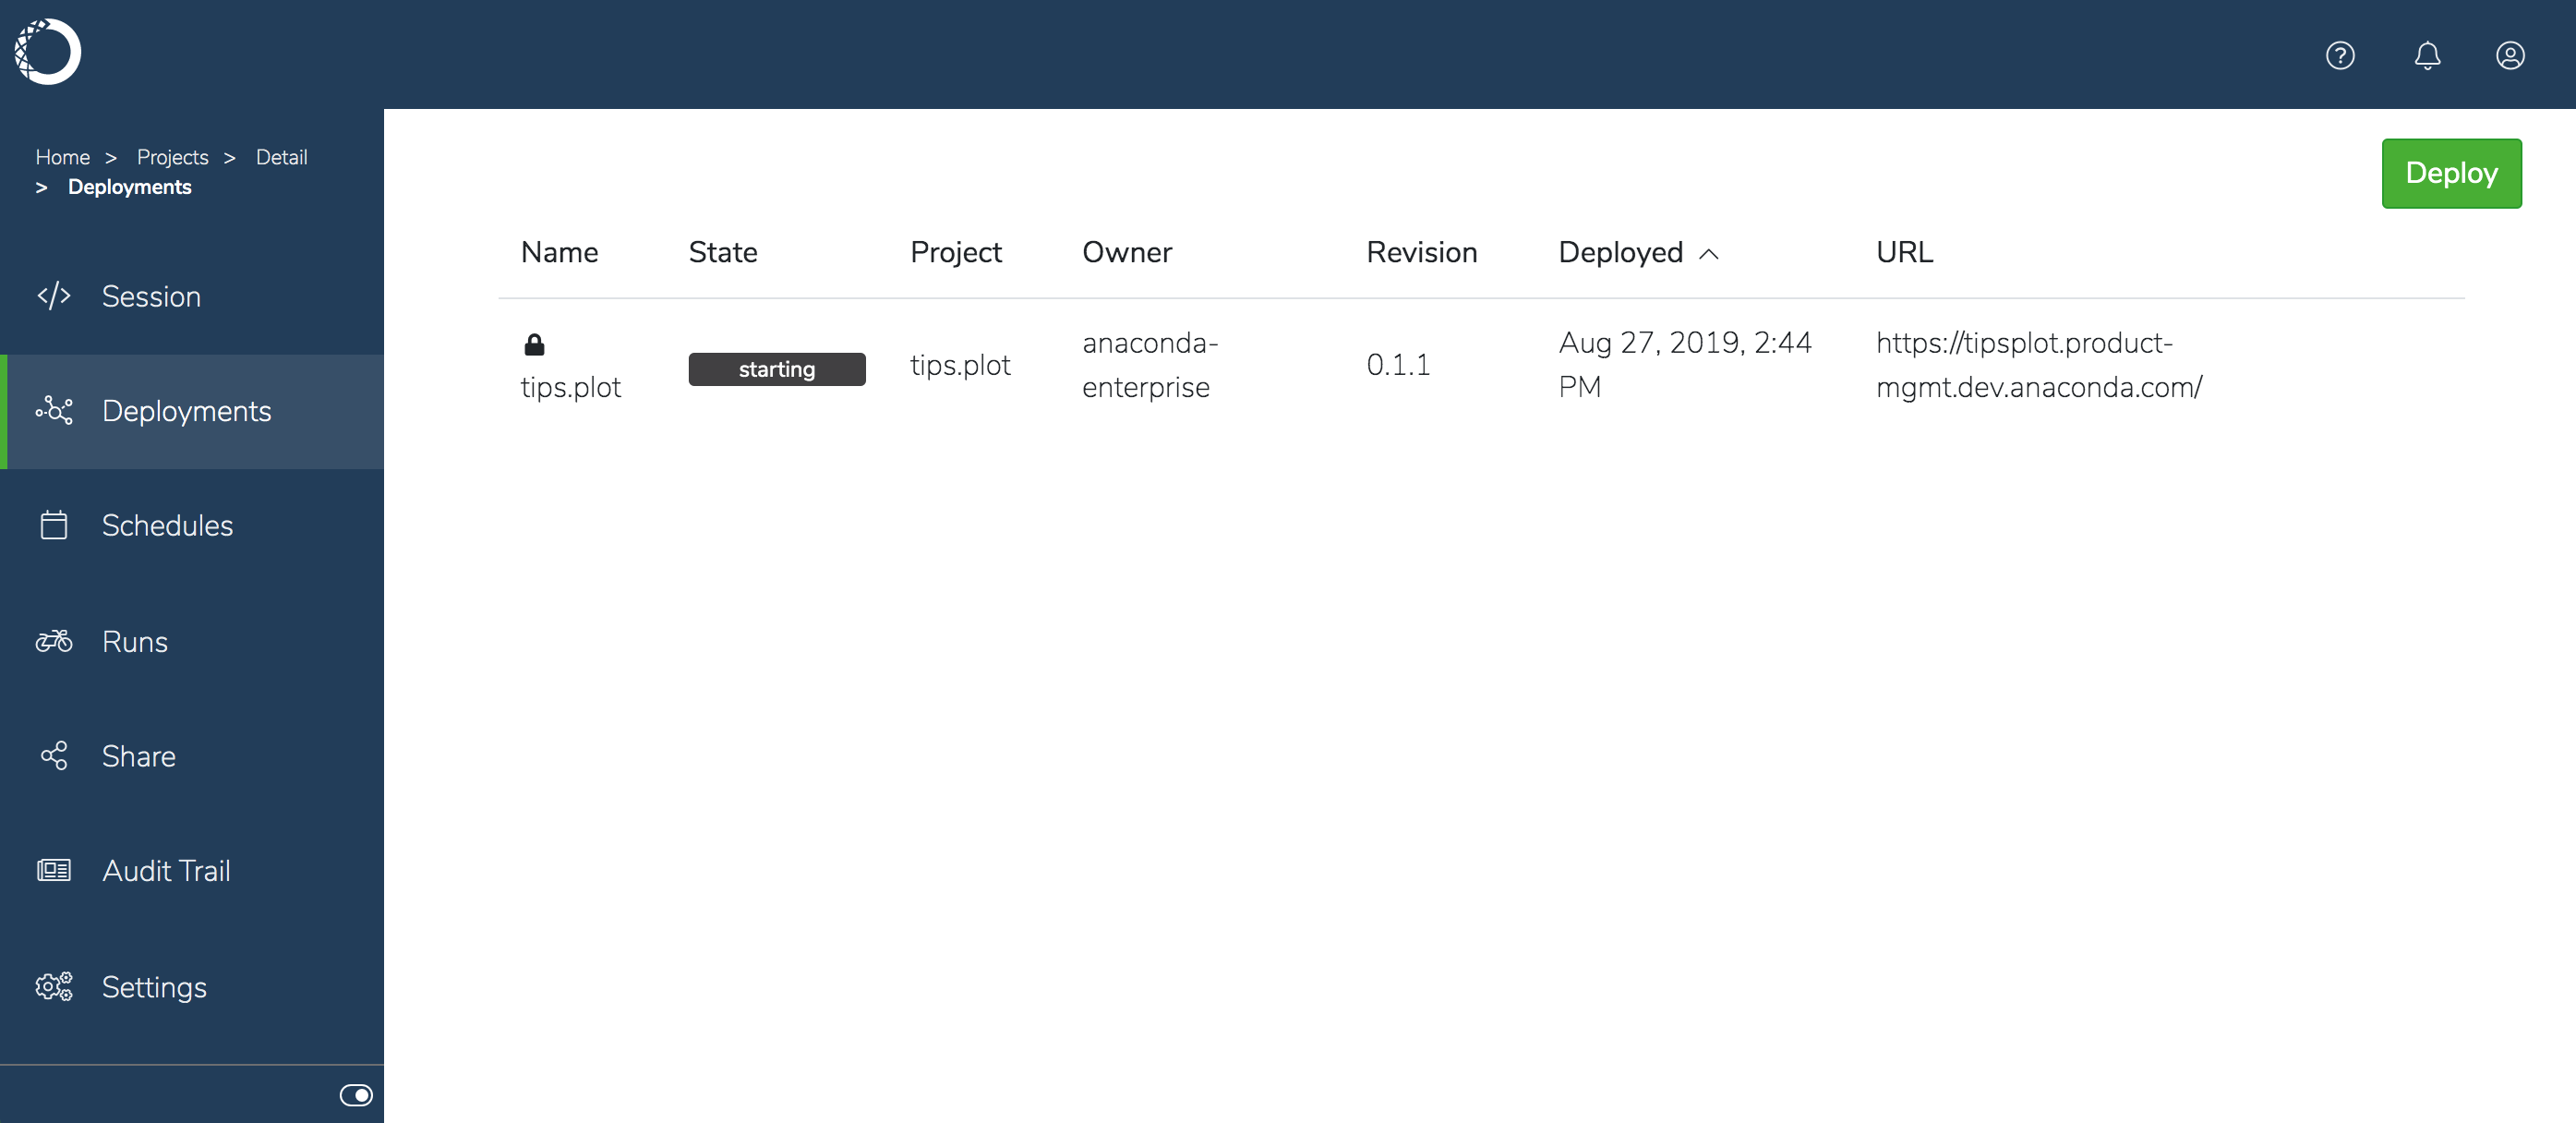
- Now you’re ready to deploy the project.