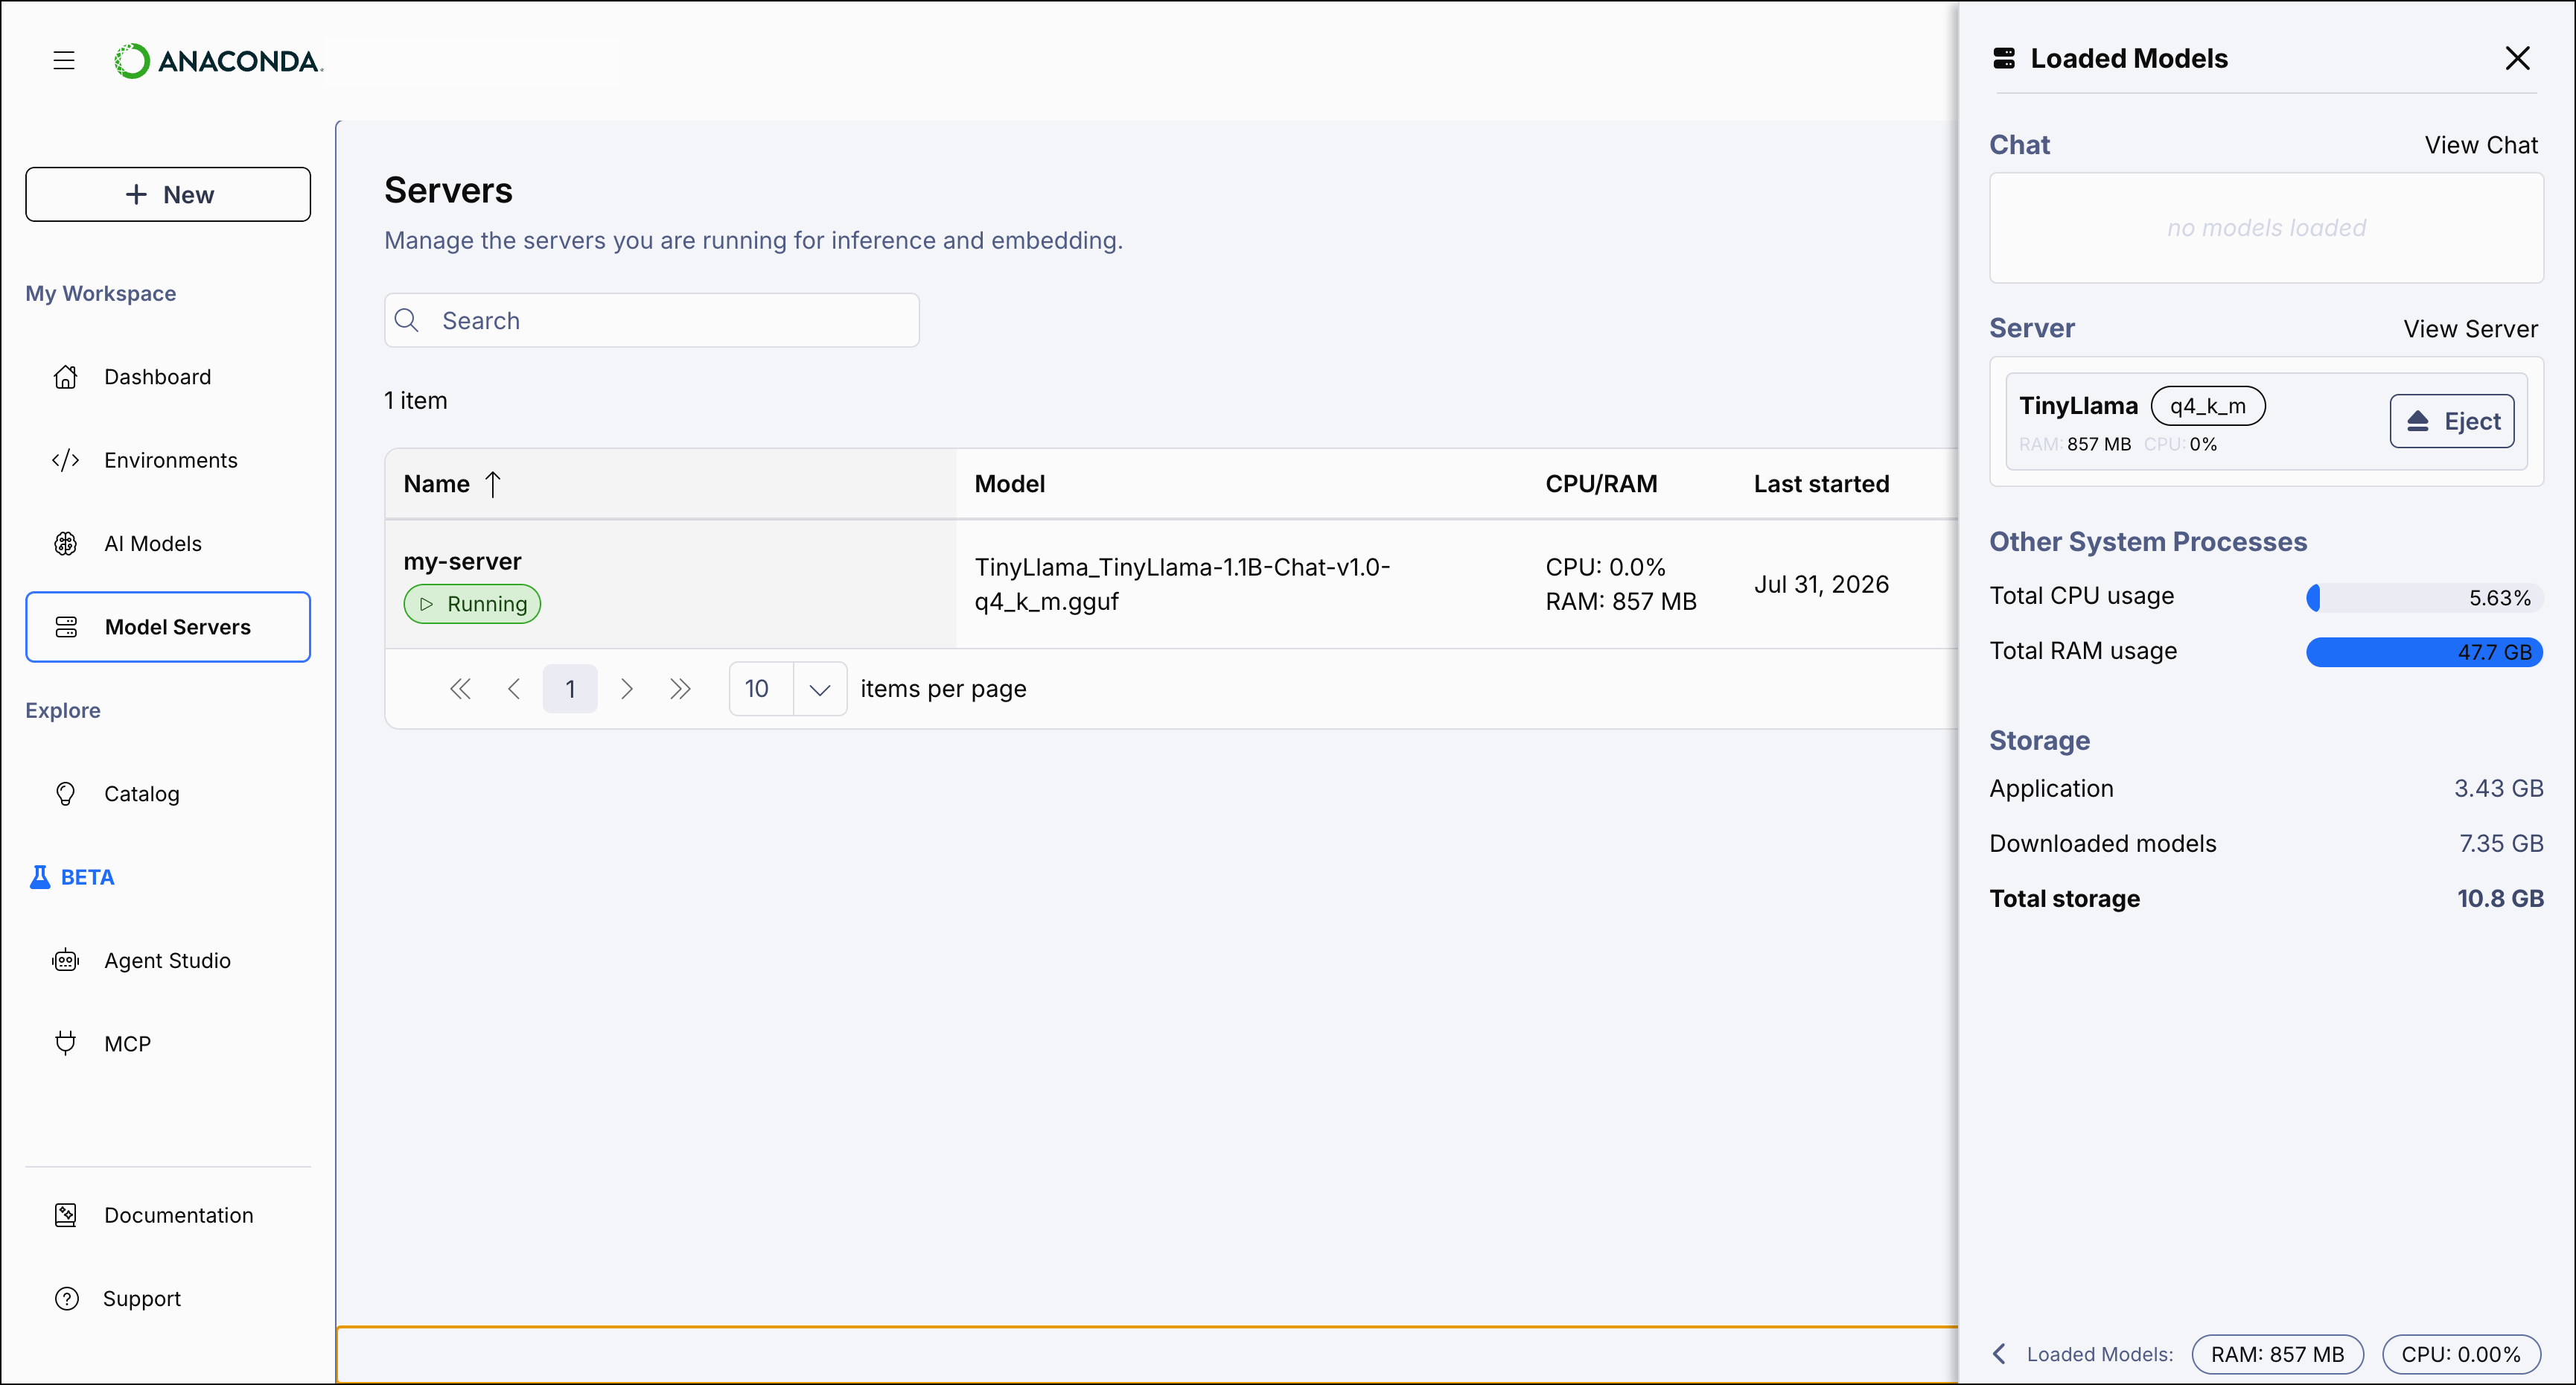
- Additional information about how many models are currently loaded
- How much system CPU and RAM you have
- How much is being consumed by the models
- How much is dedicated to other processes (outside of Desktop)
- Chat: Shows any model currently loaded in the chat interface. Click View Chat to open the chat. Click Eject to unload the model and free up consumed resources.
- Server: Shows any model currently loaded in a running model server. Click View Server to open the Model Servers page. Click Eject to stop the server and free up consumed resources.
- Other System Processes: Shows your total system CPU and RAM usage.
- Storage: Shows disk usage broken down by application and downloaded models.