> ## Documentation Index
> Fetch the complete documentation index at: https://anaconda.com/docs/llms.txt
> Use this file to discover all available pages before exploring further.
# System metrics with Prometheus
Anaconda Server system performance can be monitored to understand system health, evaluate network traffic, and detect issues. Each of the Anaconda Server services expose a set of metrics that can be visualized using the built-in Prometheus expression browser. Metrics are provided in [OpenMetrics](https://openmetrics.io/) (Prometheus) format.
## Accessing Prometheus
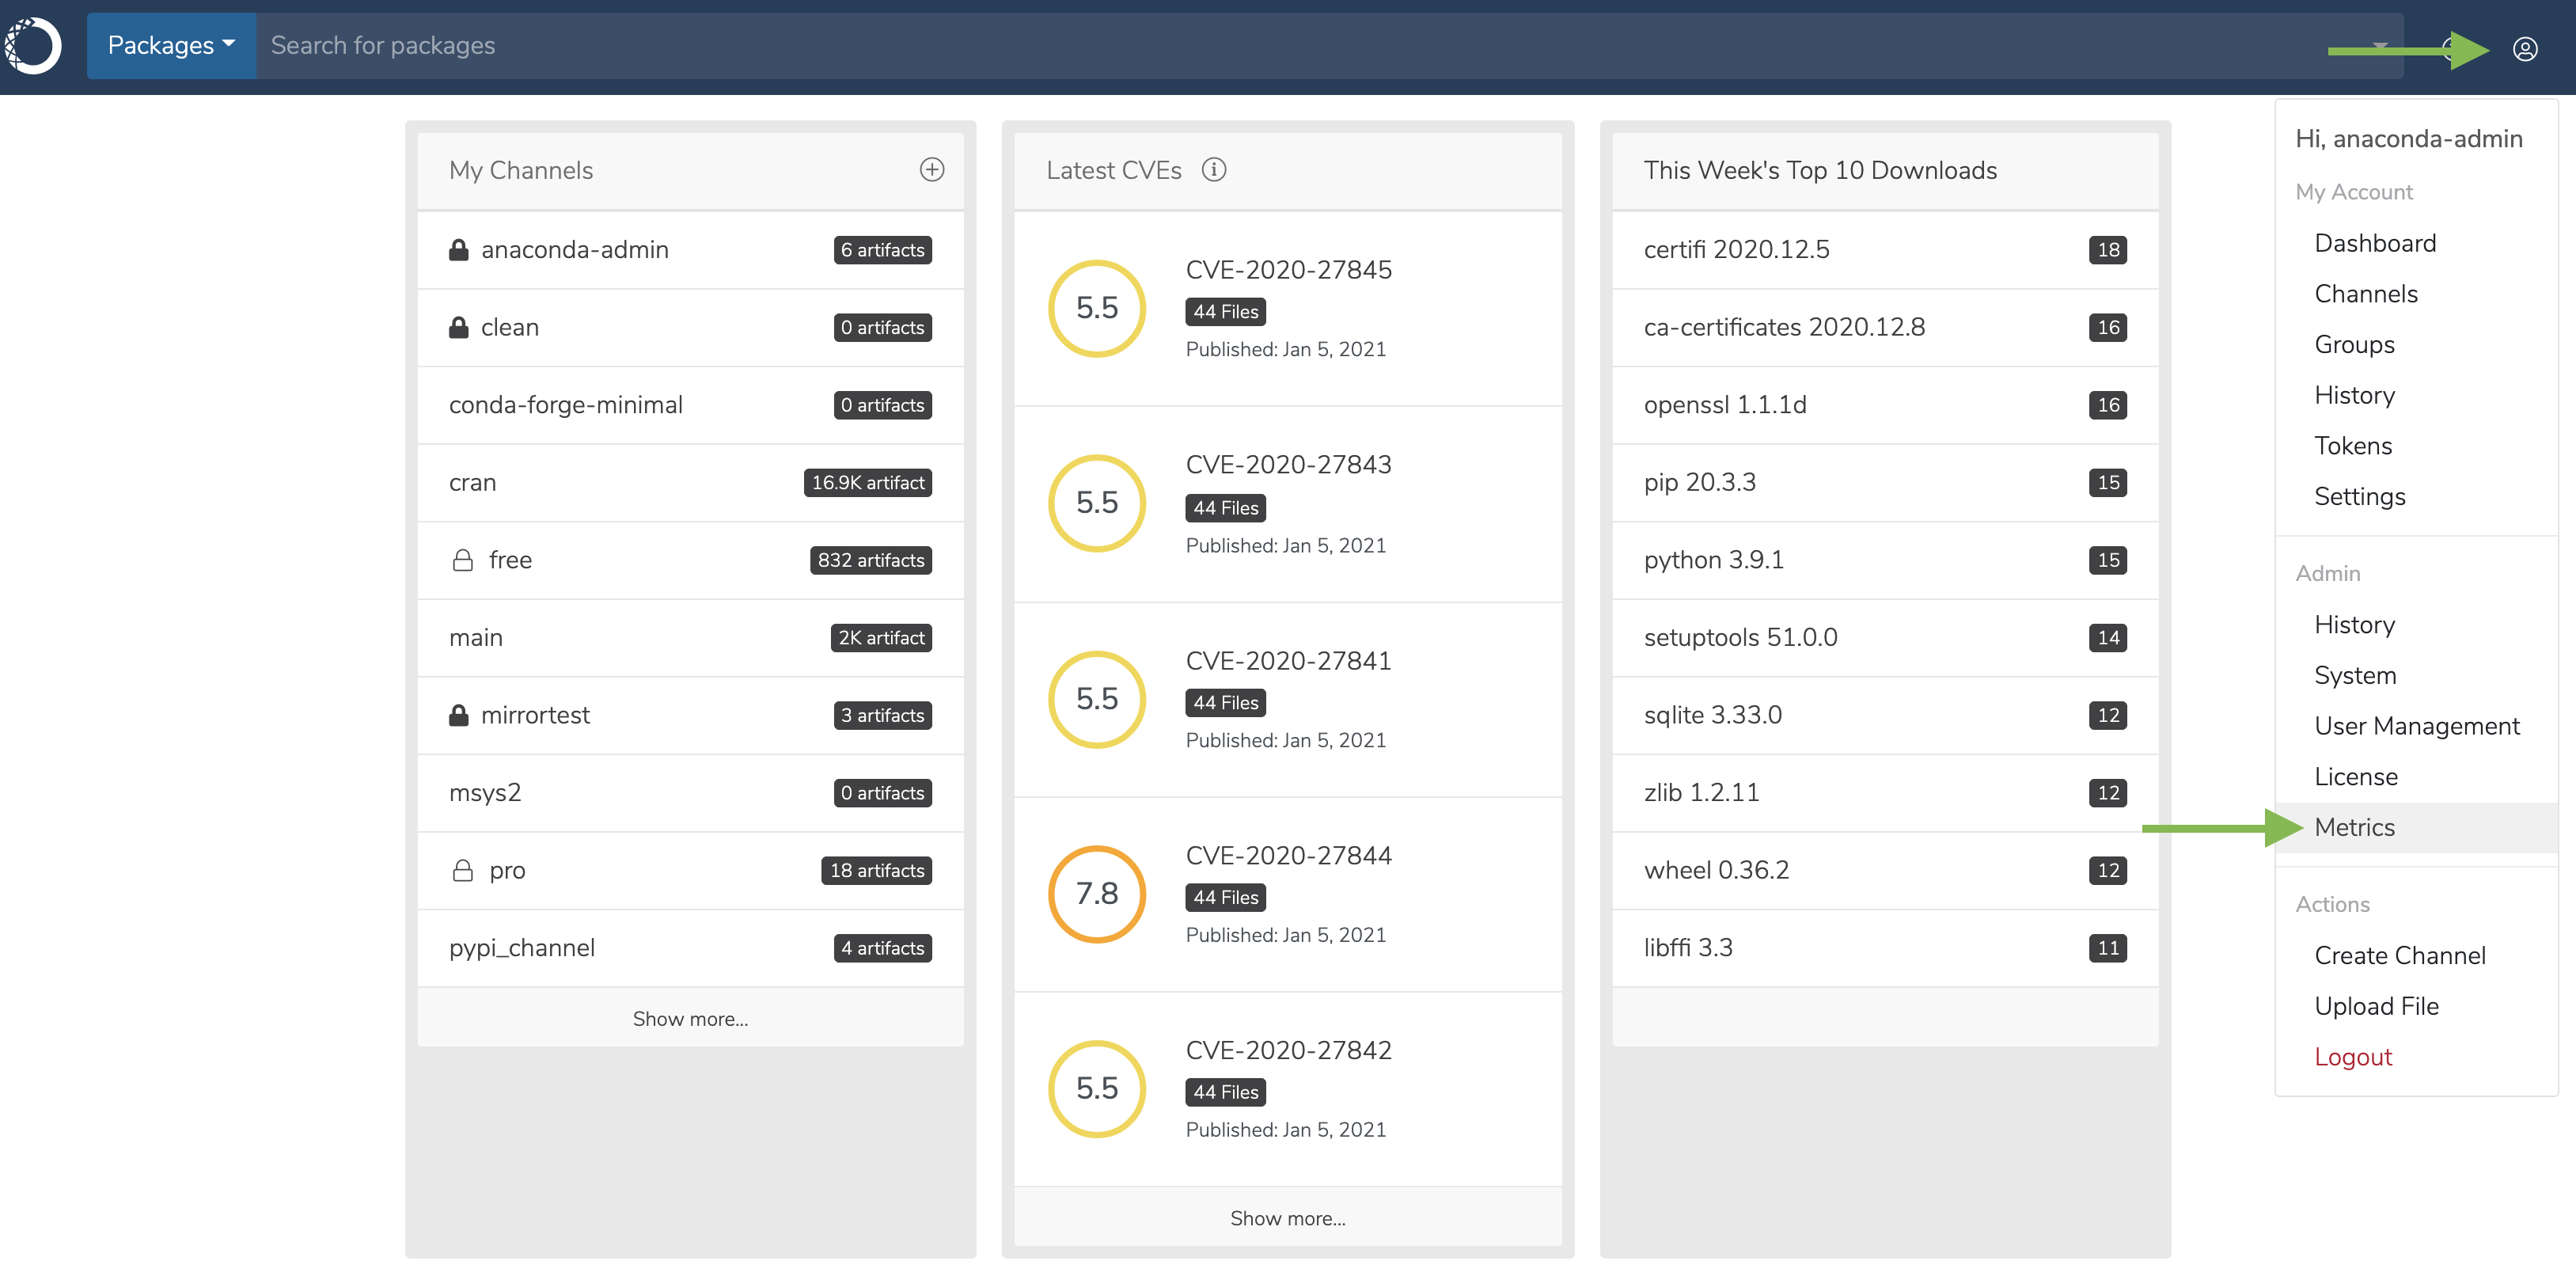
To access your system metrics from the UI, click on the **My account** button in the top right, and then click **Metrics**.
This will open a new browser tab with the root URL of the Anaconda Server installation appended with */prometheus/*. For example, *[https://yourcompany.com/prometheus/](https://yourcompany.com/prometheus/)*.
 Alternatively, you can add `/prometheus` to the root URL of the Anaconda Server installation.
## Using the expression browser
Prometheus uses a built-in expression browser for time series visualizations of system metrics.
Follow these steps to create visualizations from the expression browser:
1. Select a metric from the dropdown by clicking in the cell that reads *insert metric at cursor*.
2. Click on the **Graph** tab.
3. Select a time period. Anaconda recommends two weeks ("2w").
4. Select an "until" date, that being the point in time up to which the selected metric will displayed on the graph. The default time is the current date and time.
5. Click **Execute**.
A graph will be populated with the selected metric, and a console readout will appear beneath it.
You can isolate a single resource by clicking it in the legend below the graph.
## Popular metrics
### up
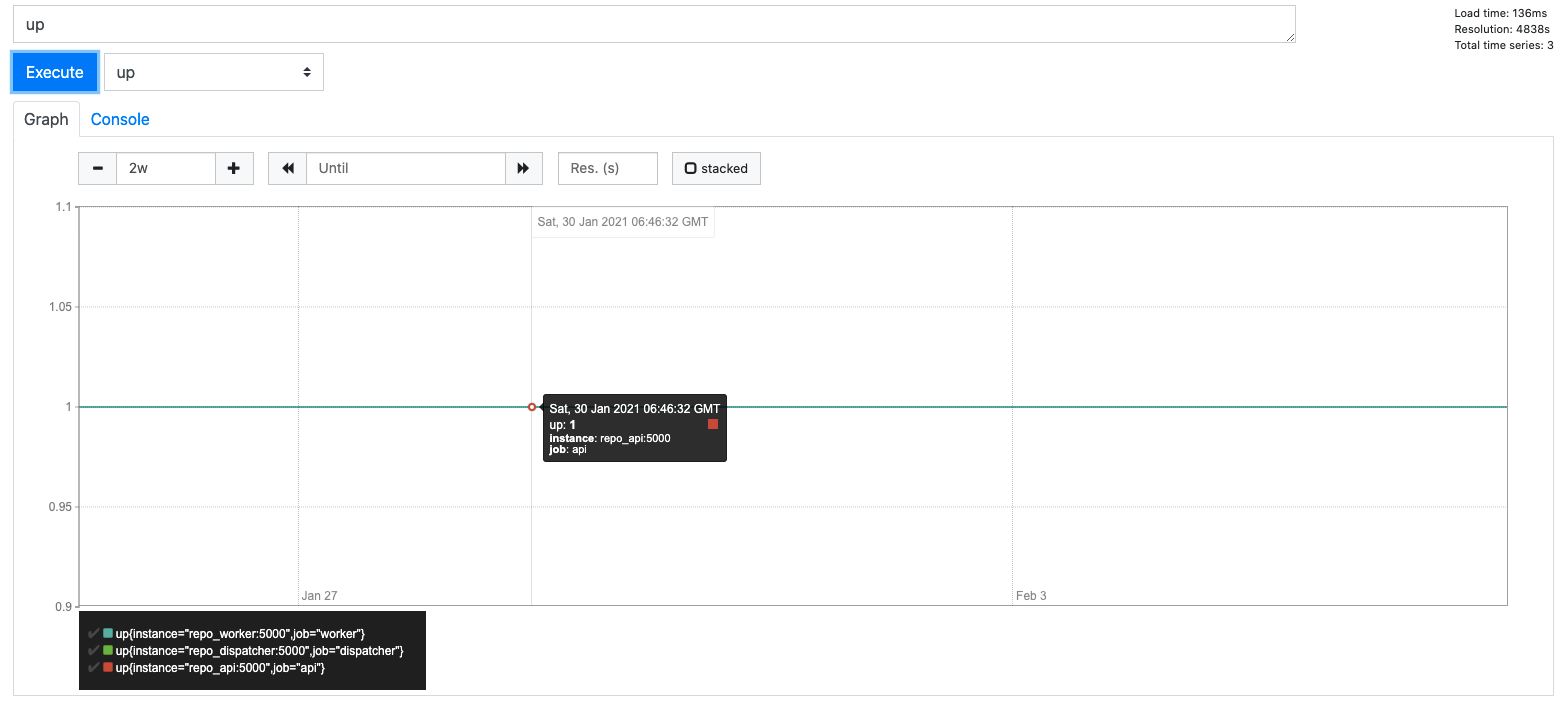
While not the most exciting graph, the `up` time metric tells you if your instance is indeed running.
Alternatively, you can add `/prometheus` to the root URL of the Anaconda Server installation.
## Using the expression browser
Prometheus uses a built-in expression browser for time series visualizations of system metrics.
Follow these steps to create visualizations from the expression browser:
1. Select a metric from the dropdown by clicking in the cell that reads *insert metric at cursor*.
2. Click on the **Graph** tab.
3. Select a time period. Anaconda recommends two weeks ("2w").
4. Select an "until" date, that being the point in time up to which the selected metric will displayed on the graph. The default time is the current date and time.
5. Click **Execute**.
A graph will be populated with the selected metric, and a console readout will appear beneath it.
You can isolate a single resource by clicking it in the legend below the graph.
## Popular metrics
### up
While not the most exciting graph, the `up` time metric tells you if your instance is indeed running.
 ### process\_open\_fds
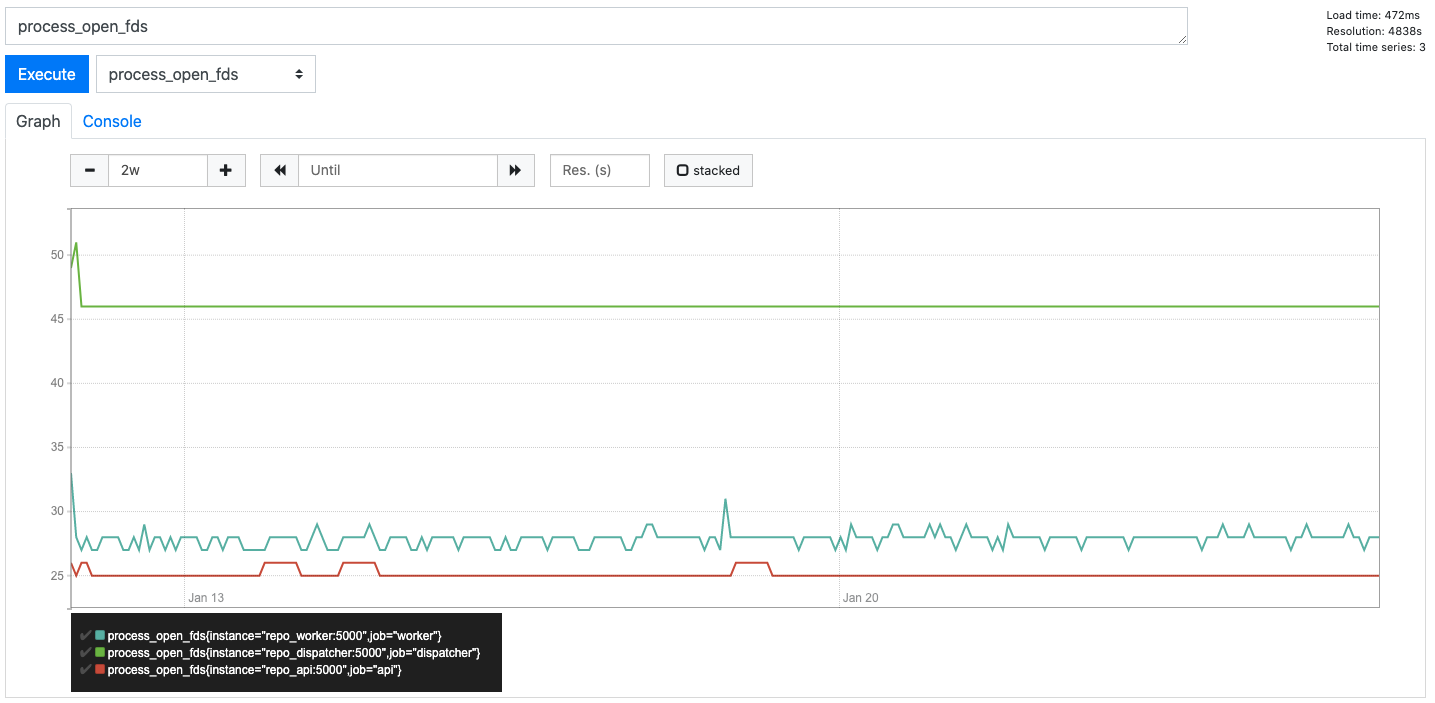
`process_open_fds` counts the number of files in `/proc/PID/fd` directory.
This tells you how many regular files, sockets, pseudo terminals, and other processes you currently have open.
### process\_open\_fds
`process_open_fds` counts the number of files in `/proc/PID/fd` directory.
This tells you how many regular files, sockets, pseudo terminals, and other processes you currently have open.
 ### process\_max\_fds
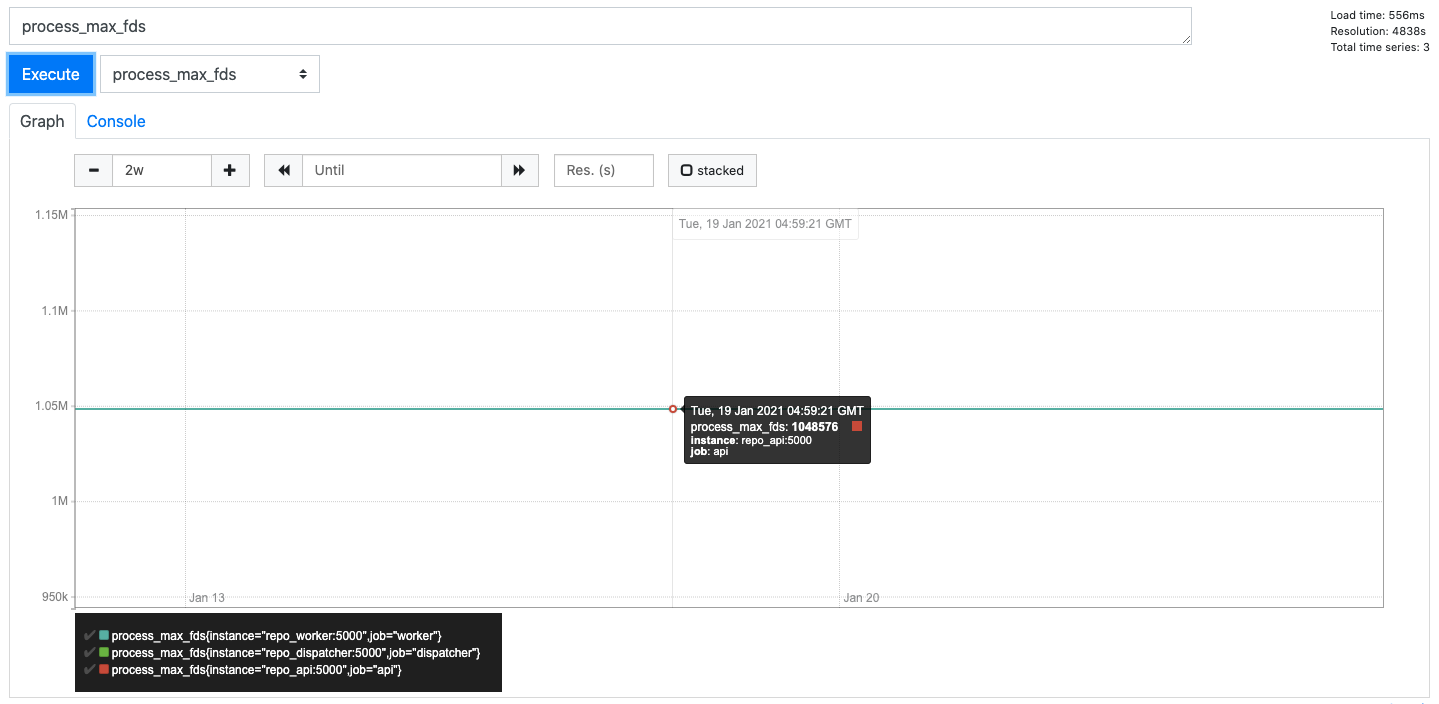
`process_max_fds` reads `/proc//limits` and uses the **Soft Limit** from the **Max Open Files** row.
Interestingly, `/limits` lists both soft and hard limits. The soft limit is the value the kernel enforces for the corresponding resource,
while the hard limit acts as the ceiling for the soft limit.
### process\_max\_fds
`process_max_fds` reads `/proc//limits` and uses the **Soft Limit** from the **Max Open Files** row.
Interestingly, `/limits` lists both soft and hard limits. The soft limit is the value the kernel enforces for the corresponding resource,
while the hard limit acts as the ceiling for the soft limit.
 ## Setting a file limit alert
Using the two metrics above, `process_open_fds` and `process_max_fds`, you can quickly
write an alert to warn you when a process hits, say, 80% of the limit:
```sh theme={null}
groups:
- name: example
rules:
- alert: ProcessNearFDLimits
expr: process_open_fds / process_max_fds > 0.8
for: 10m
```
## Setting a file limit alert
Using the two metrics above, `process_open_fds` and `process_max_fds`, you can quickly
write an alert to warn you when a process hits, say, 80% of the limit:
```sh theme={null}
groups:
- name: example
rules:
- alert: ProcessNearFDLimits
expr: process_open_fds / process_max_fds > 0.8
for: 10m
```