> ## Documentation Index
> Fetch the complete documentation index at: https://anaconda.com/docs/llms.txt
> Use this file to discover all available pages before exploring further.
# Troubleshooting
Anaconda’s Data Science & AI Workbench provides detailed logs and monitoring information related to the Kubernetes services and containers it uses. Gravity-based installations can use the provided Operations Center and Kubernetes CLI to access this information, to help diagnose and debug errors that you or other users may encounter while using the platform.
## Gravity troubleshooting
Administrators can access the Operations Center to configure, monitor, and troubleshoot the platform.
**To access the Operations Center:**
1. Log in to Workbench, select **Menu** in the top right corner, and click the **Administrative Console** link displayed at the bottom of the slide out window.
2. Click **Manage Resources**.
3. Login to the Operations Center using the Administrator credentials [configured after installation](/docs/data-science/latest/install/config).
**To view resource utilization:**
1. Select **Servers** in the menu on the left.
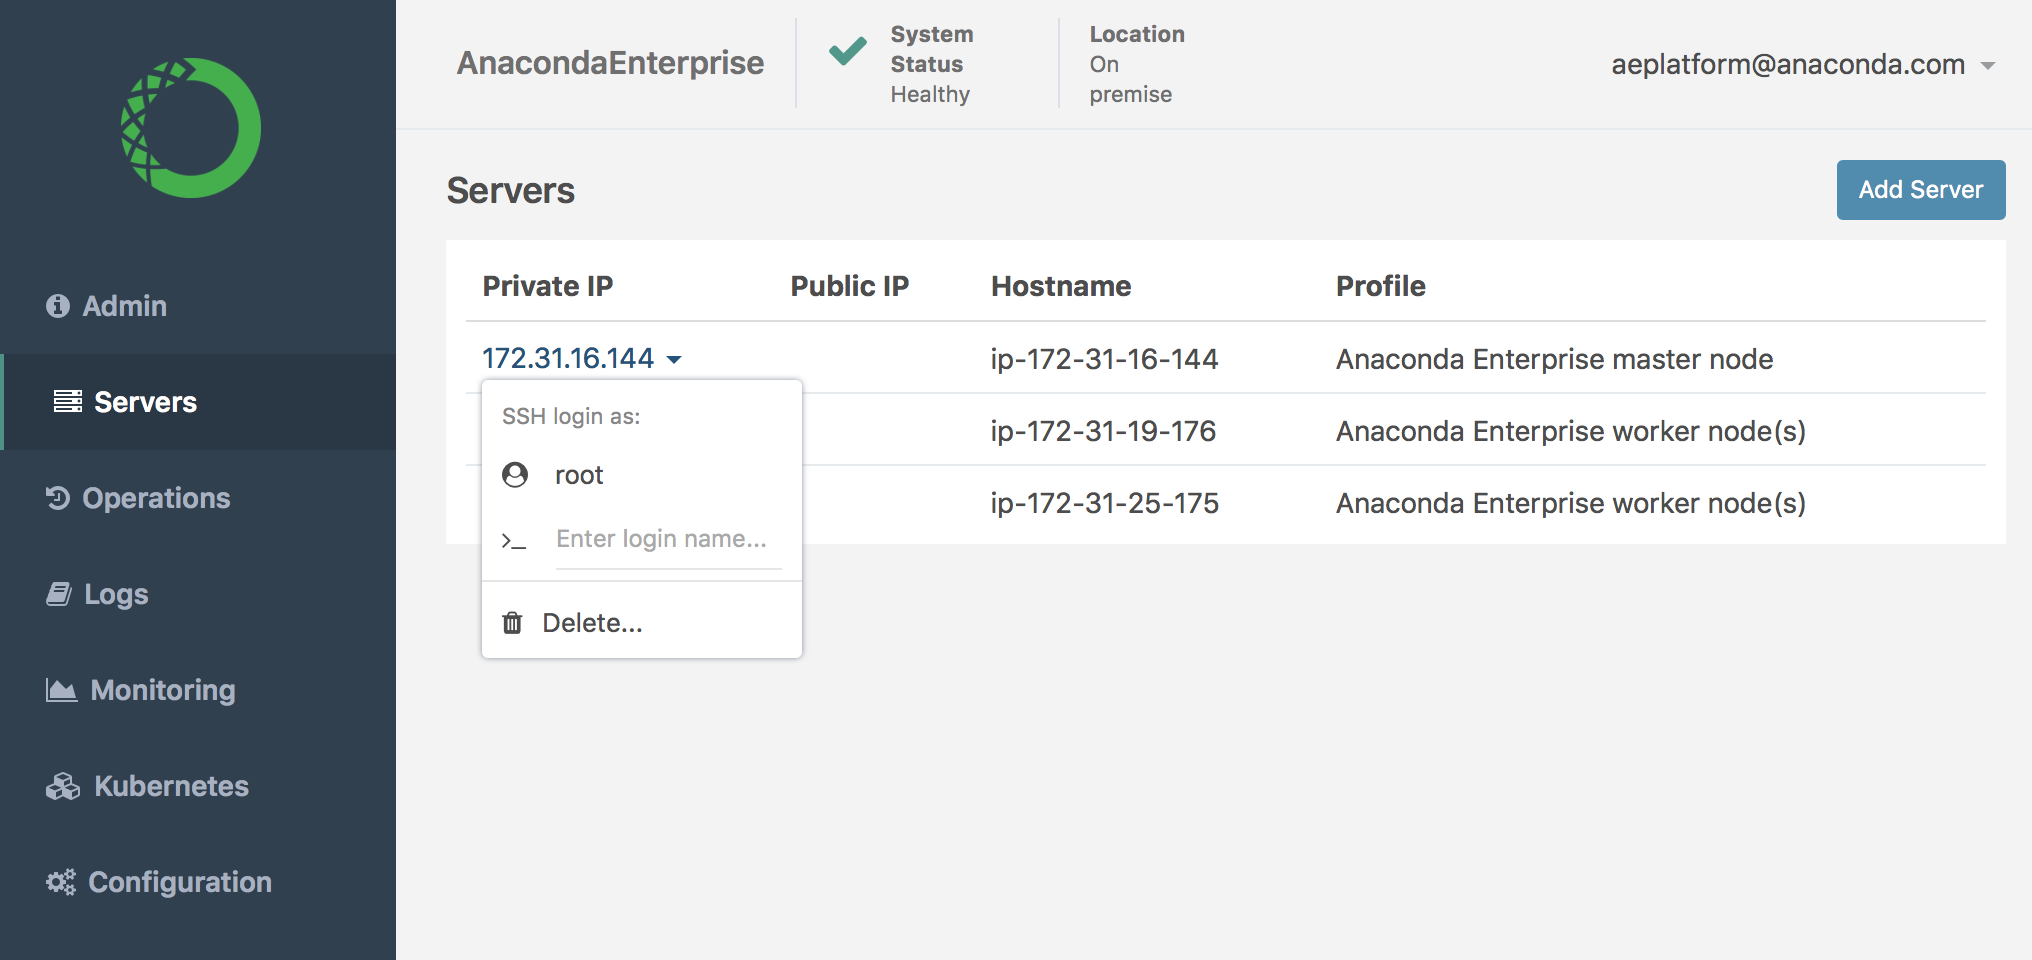
2. Click on the Private IP address of the Workbench master node, and select **SSH login as root**.
 3. To display the current resource utilization of each *node* in the cluster, run this command:
```
kubectl top nodes --heapster-namespace=monitoring
```
3. To display the current resource utilization of each *node* in the cluster, run this command:
```
kubectl top nodes --heapster-namespace=monitoring
```
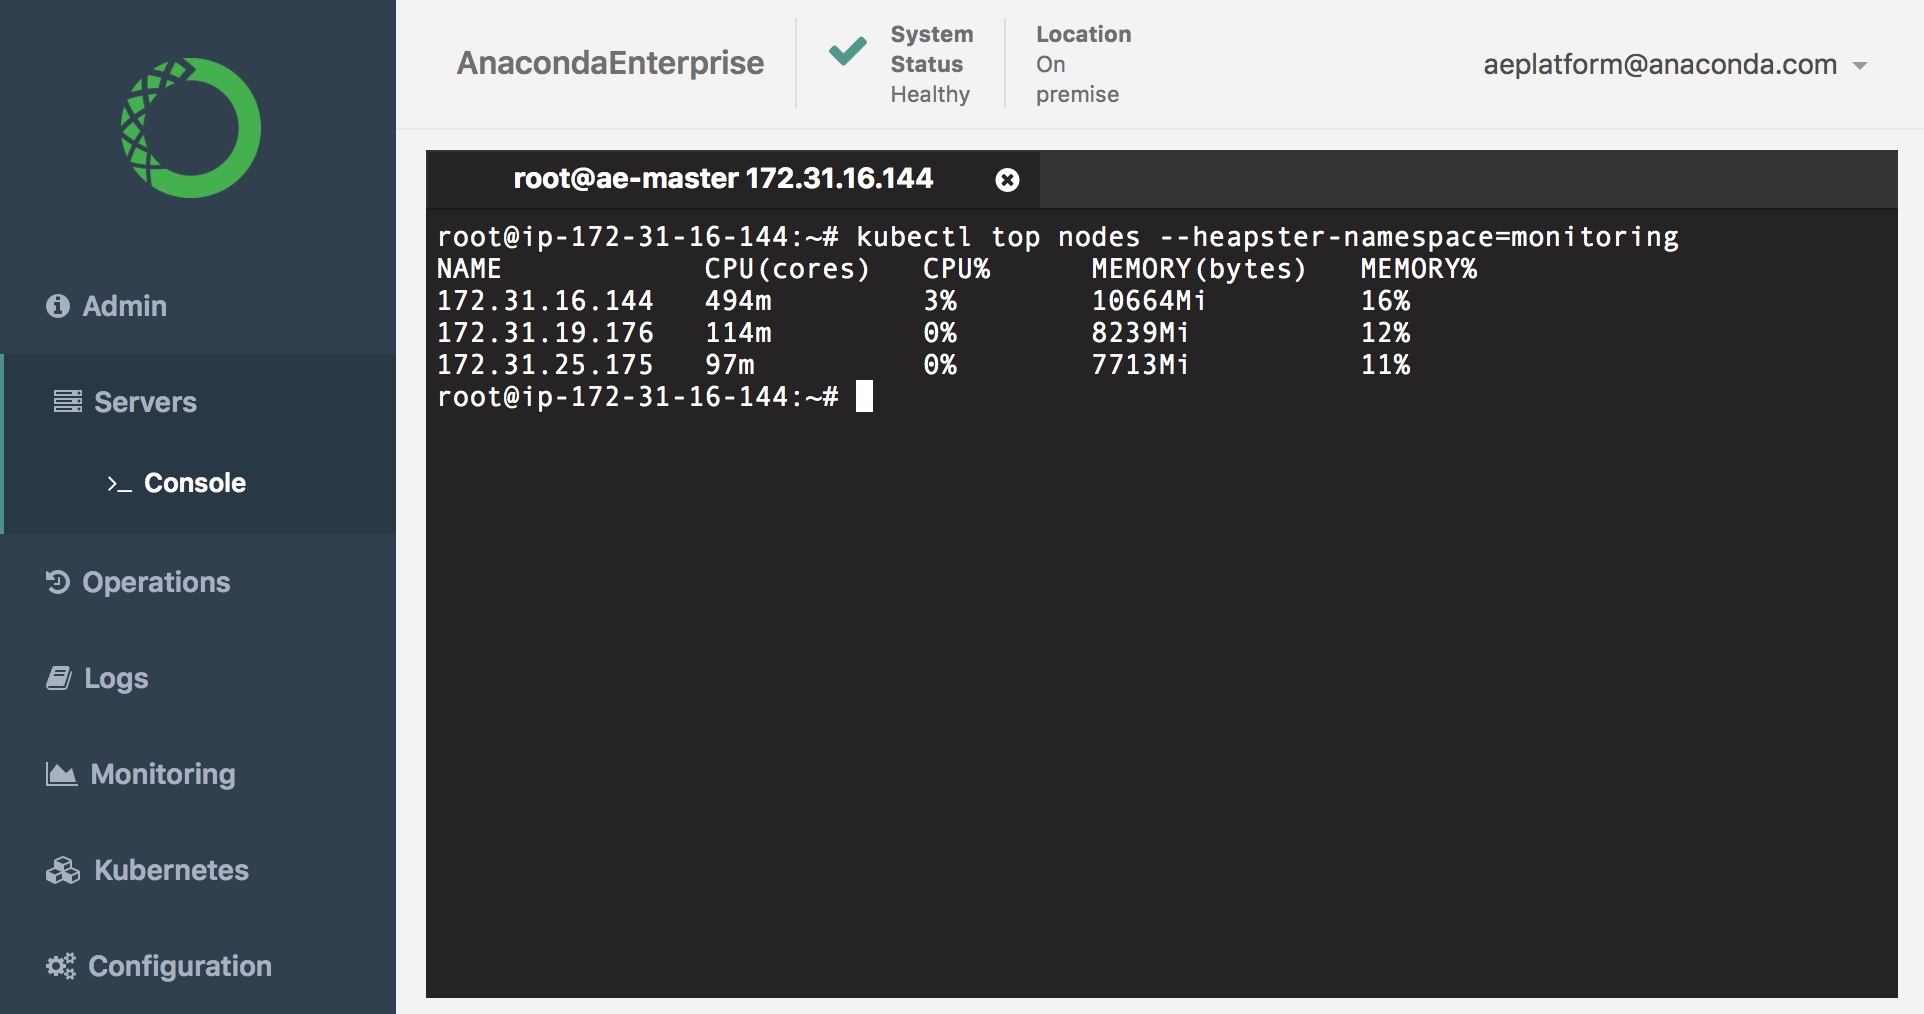 This is actual resource utilization, not limits or requests.
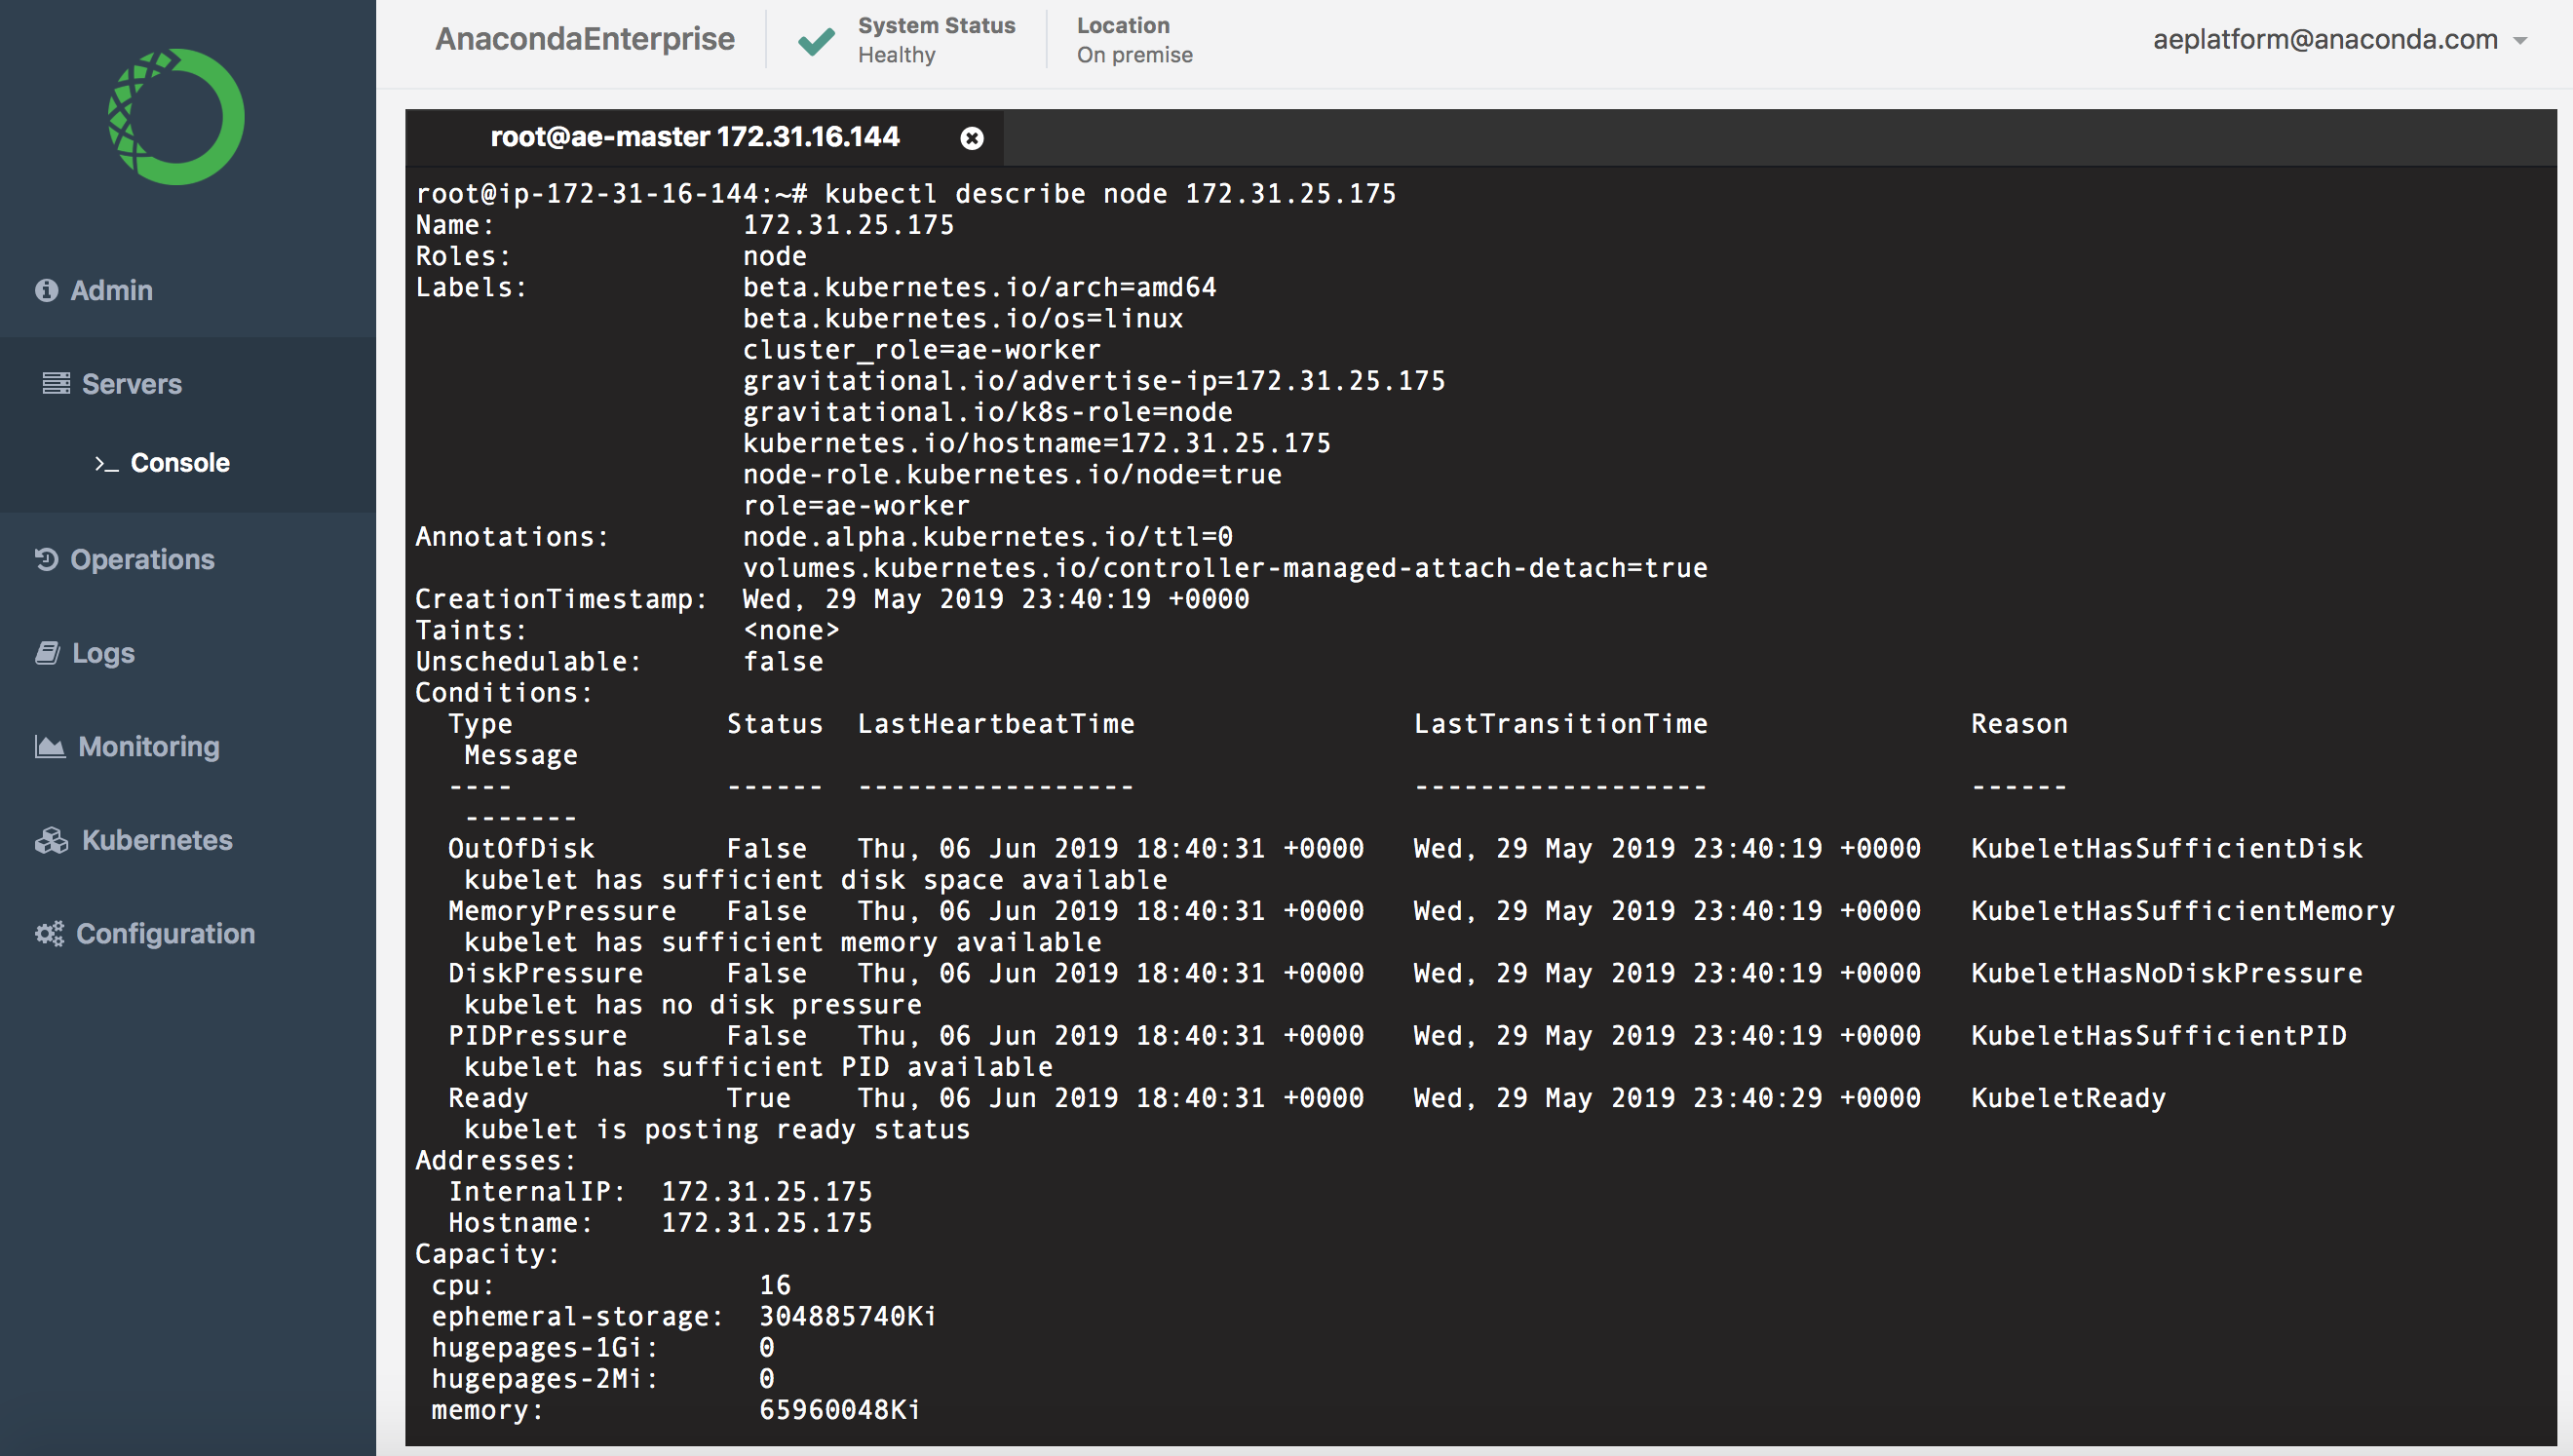
4. To view utilization *and requests* for a particular node, run the `kubectl describe node` command against the IP address for the node (listed under `NAME`). For example:
```
kubectl describe node 172.31.25.175
```
This is actual resource utilization, not limits or requests.
4. To view utilization *and requests* for a particular node, run the `kubectl describe node` command against the IP address for the node (listed under `NAME`). For example:
```
kubectl describe node 172.31.25.175
```
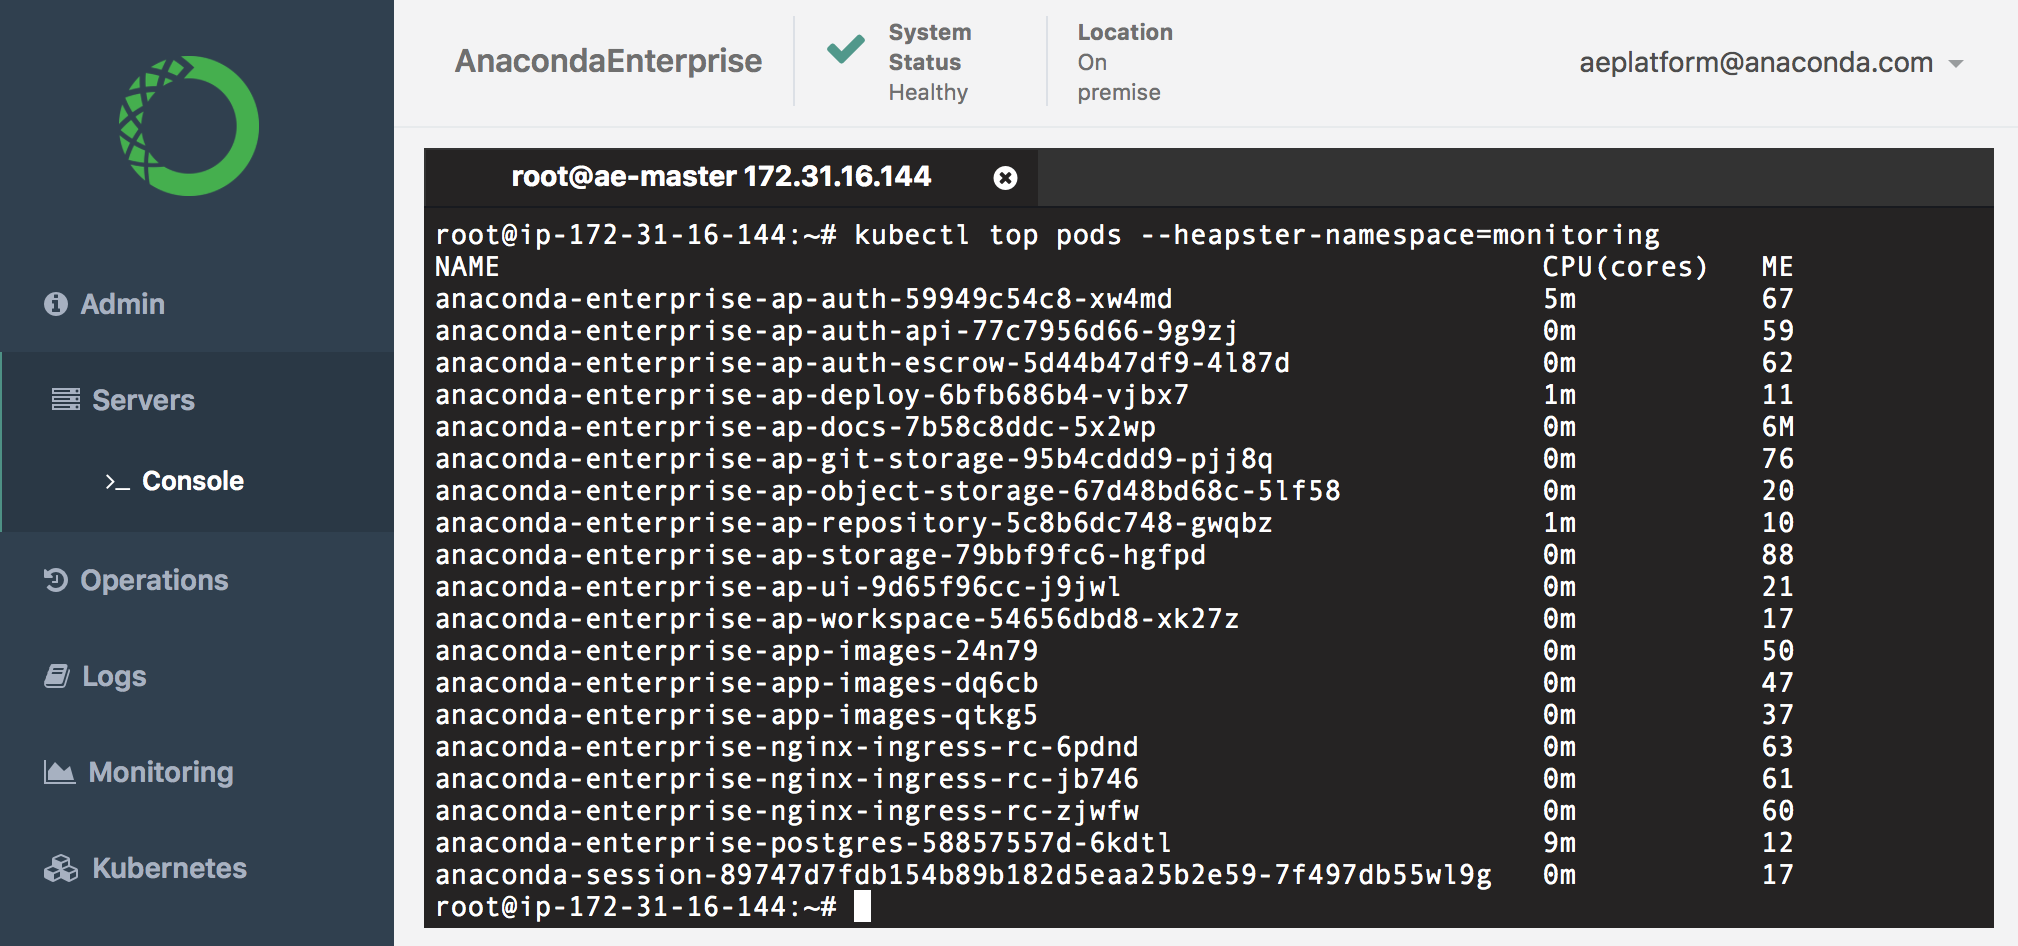
 5. To view the resource utilization per *pod*, run this command:
```
kubectl top pods --heapster-namespace=monitoring
```
5. To view the resource utilization per *pod*, run this command:
```
kubectl top pods --heapster-namespace=monitoring
```
 6. To view the current status of all pods in the cluster, run `kubectl get pods`.
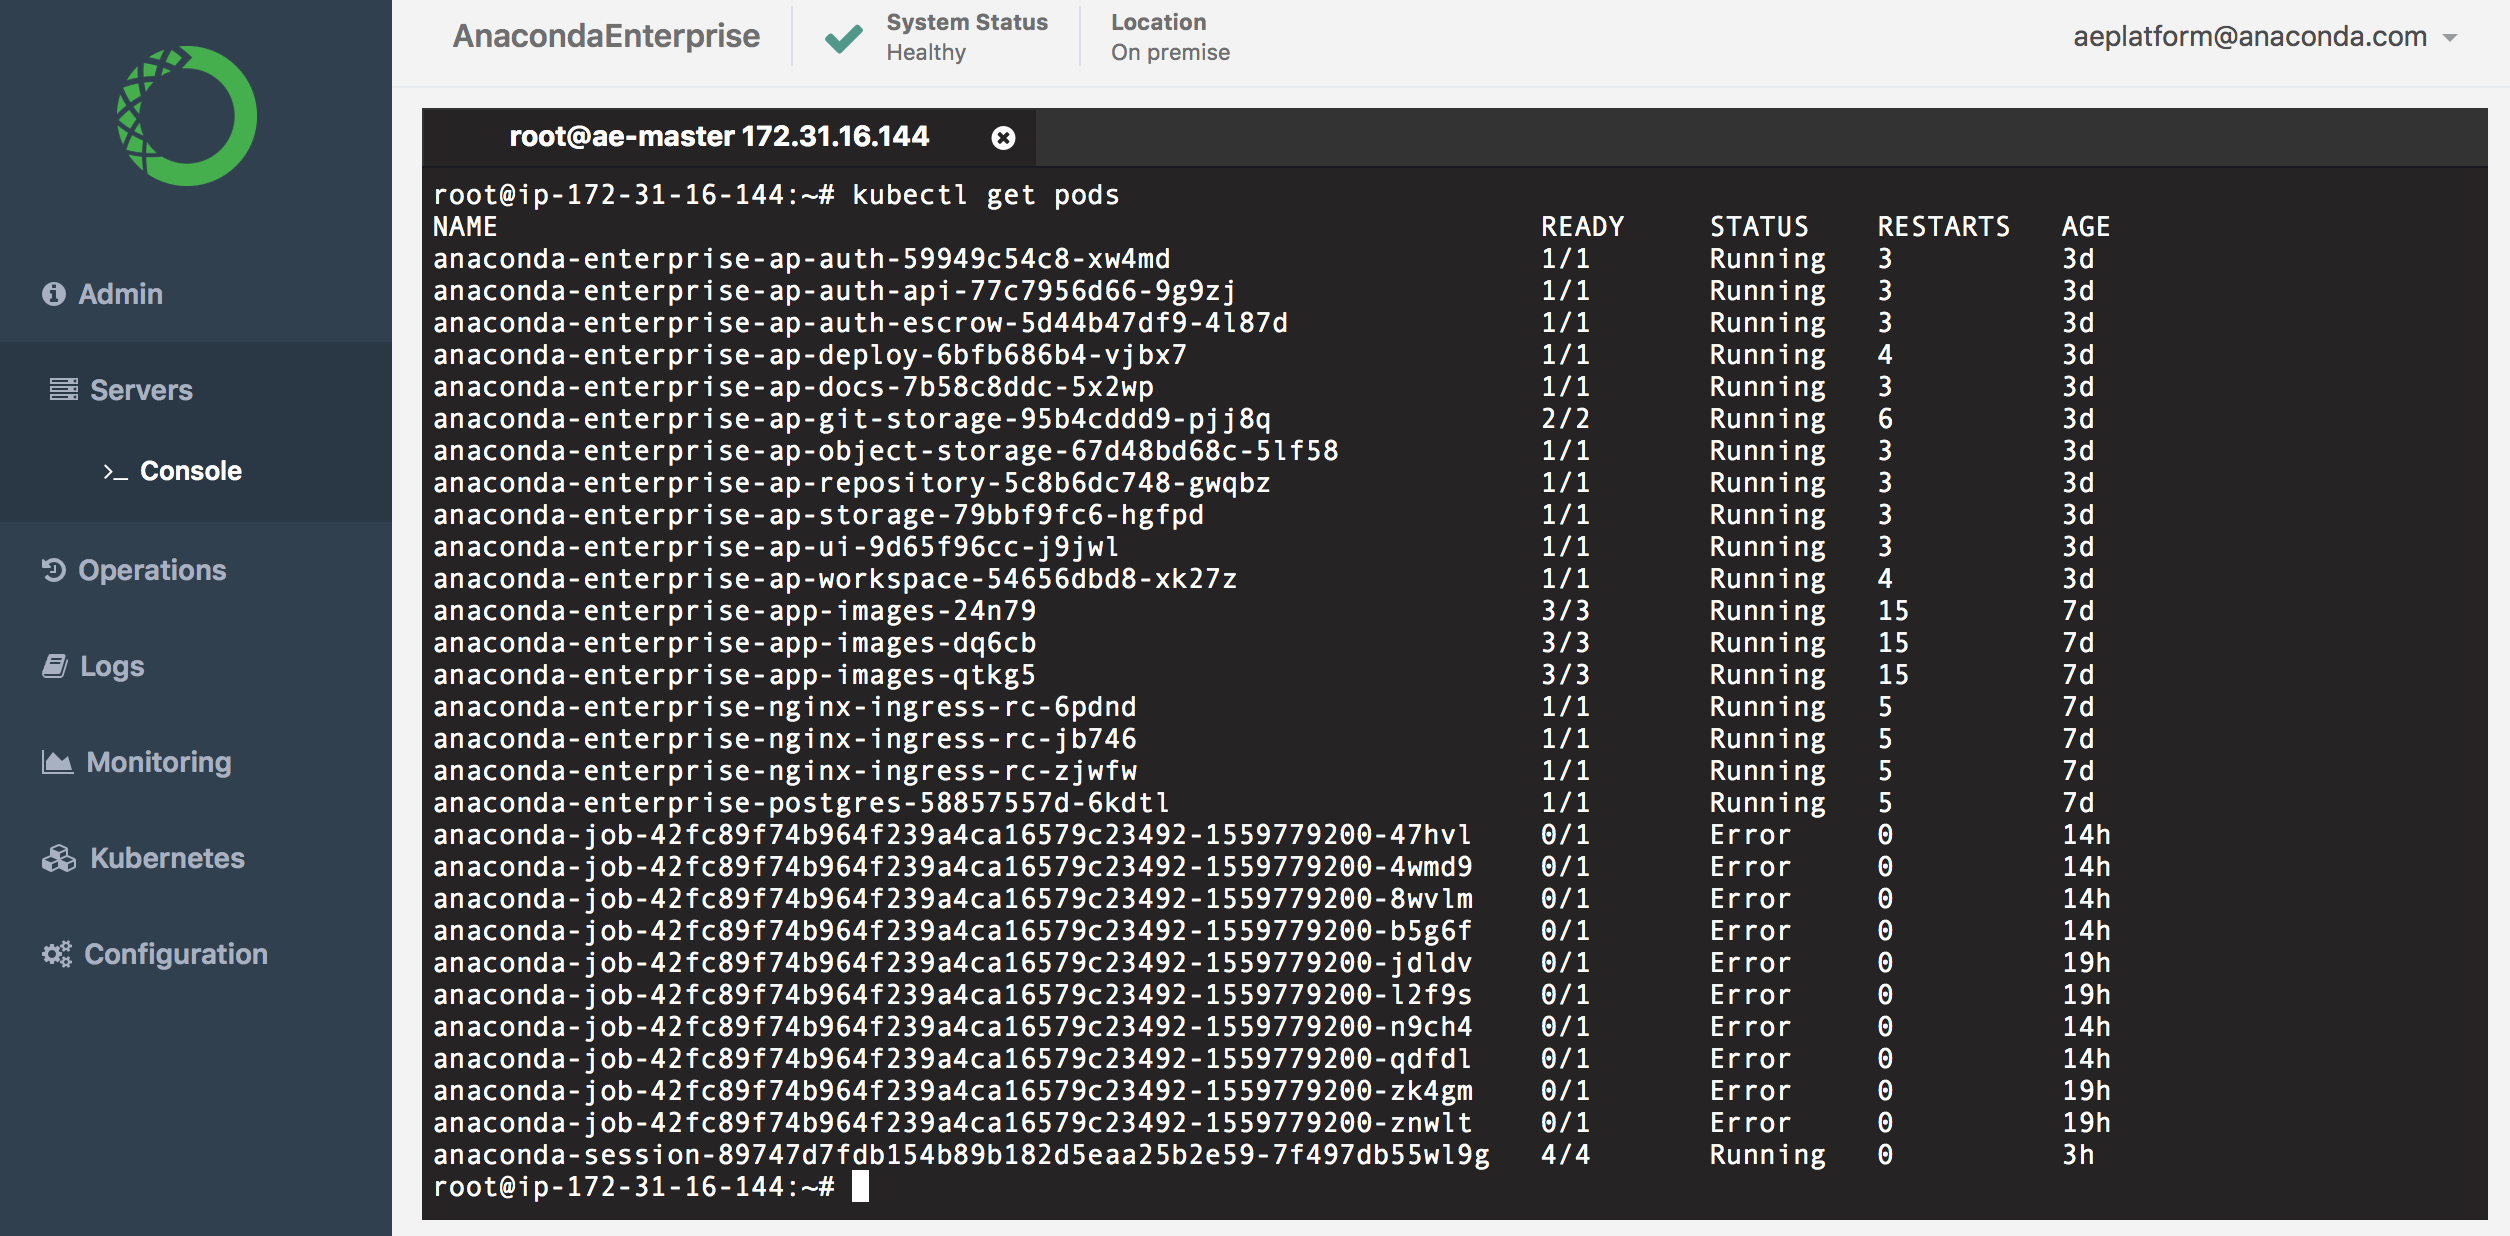 The following table summarizes common pod states:
| Status | Description |
| :-------------------- | :----------------------------------------------------------------------- |
| Running | The pod has been bound to a node, and at least one container is running. |
| Pending | The pod is waiting for one or more container images to be created. |
| Terminating | The pod is in the process of being terminated. |
| Error | An error has occurred with the pod. |
| Init:CrashLoopBackoff | The pod failed to start, and will make another attempt in a few minutes. |
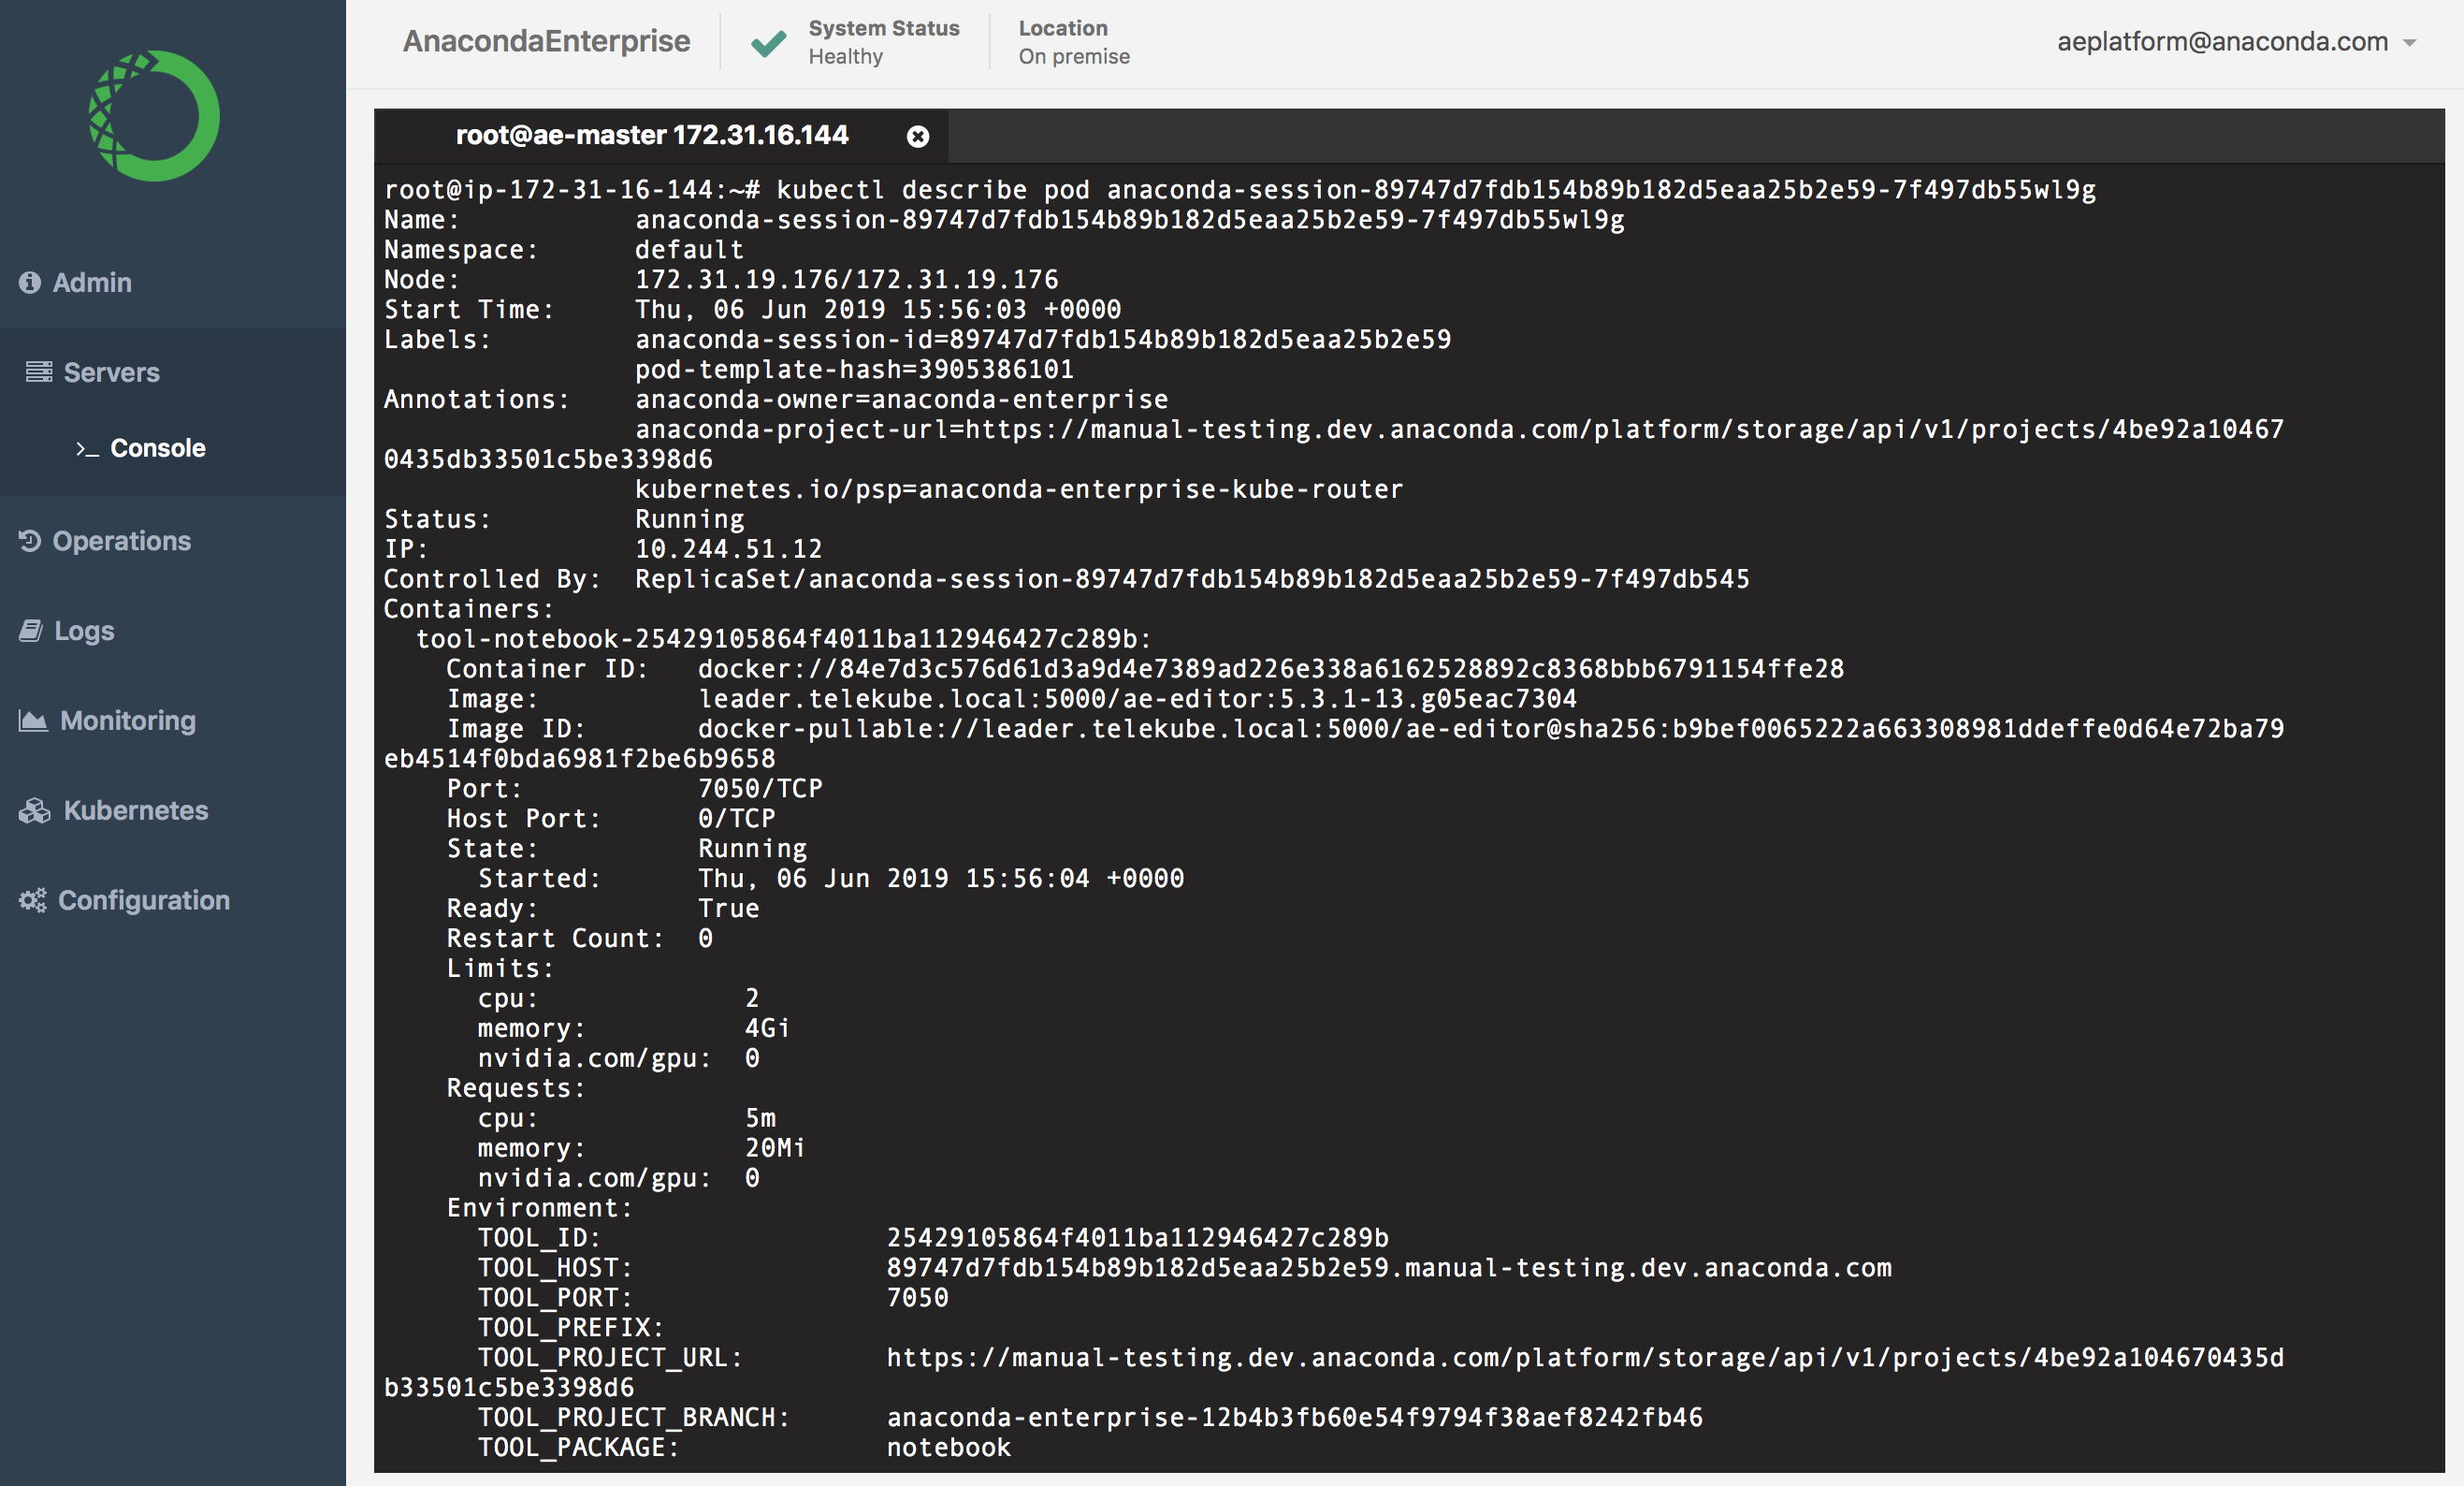
7. To view information for a particular pod, run the `kubectl describe pod` command against the pod (listed under `NAME`). For example:
```
kubectl describe pod anaconda-session-89747d7fdb154b89b182d5eaa25b2e59-7f497db55wl9g
```
The following table summarizes common pod states:
| Status | Description |
| :-------------------- | :----------------------------------------------------------------------- |
| Running | The pod has been bound to a node, and at least one container is running. |
| Pending | The pod is waiting for one or more container images to be created. |
| Terminating | The pod is in the process of being terminated. |
| Error | An error has occurred with the pod. |
| Init:CrashLoopBackoff | The pod failed to start, and will make another attempt in a few minutes. |
7. To view information for a particular pod, run the `kubectl describe pod` command against the pod (listed under `NAME`). For example:
```
kubectl describe pod anaconda-session-89747d7fdb154b89b182d5eaa25b2e59-7f497db55wl9g
```
 You can also use the Operations Center **Logs** to gain insights into pod behavior and troubleshoot issues. See [logging](/docs/data-science/latest/admin/resources/gravity/logging) for more information.
## User errors
If a user experiences issues within a Notebook session, have them send you the name of the pod associated with their project session. They can obtain this information by running the `hostname` command from within a Jupyter Notebook or terminal window.
You can also use the Operations Center **Logs** to gain insights into pod behavior and troubleshoot issues. See [logging](/docs/data-science/latest/admin/resources/gravity/logging) for more information.
## User errors
If a user experiences issues within a Notebook session, have them send you the name of the pod associated with their project session. They can obtain this information by running the `hostname` command from within a Jupyter Notebook or terminal window.
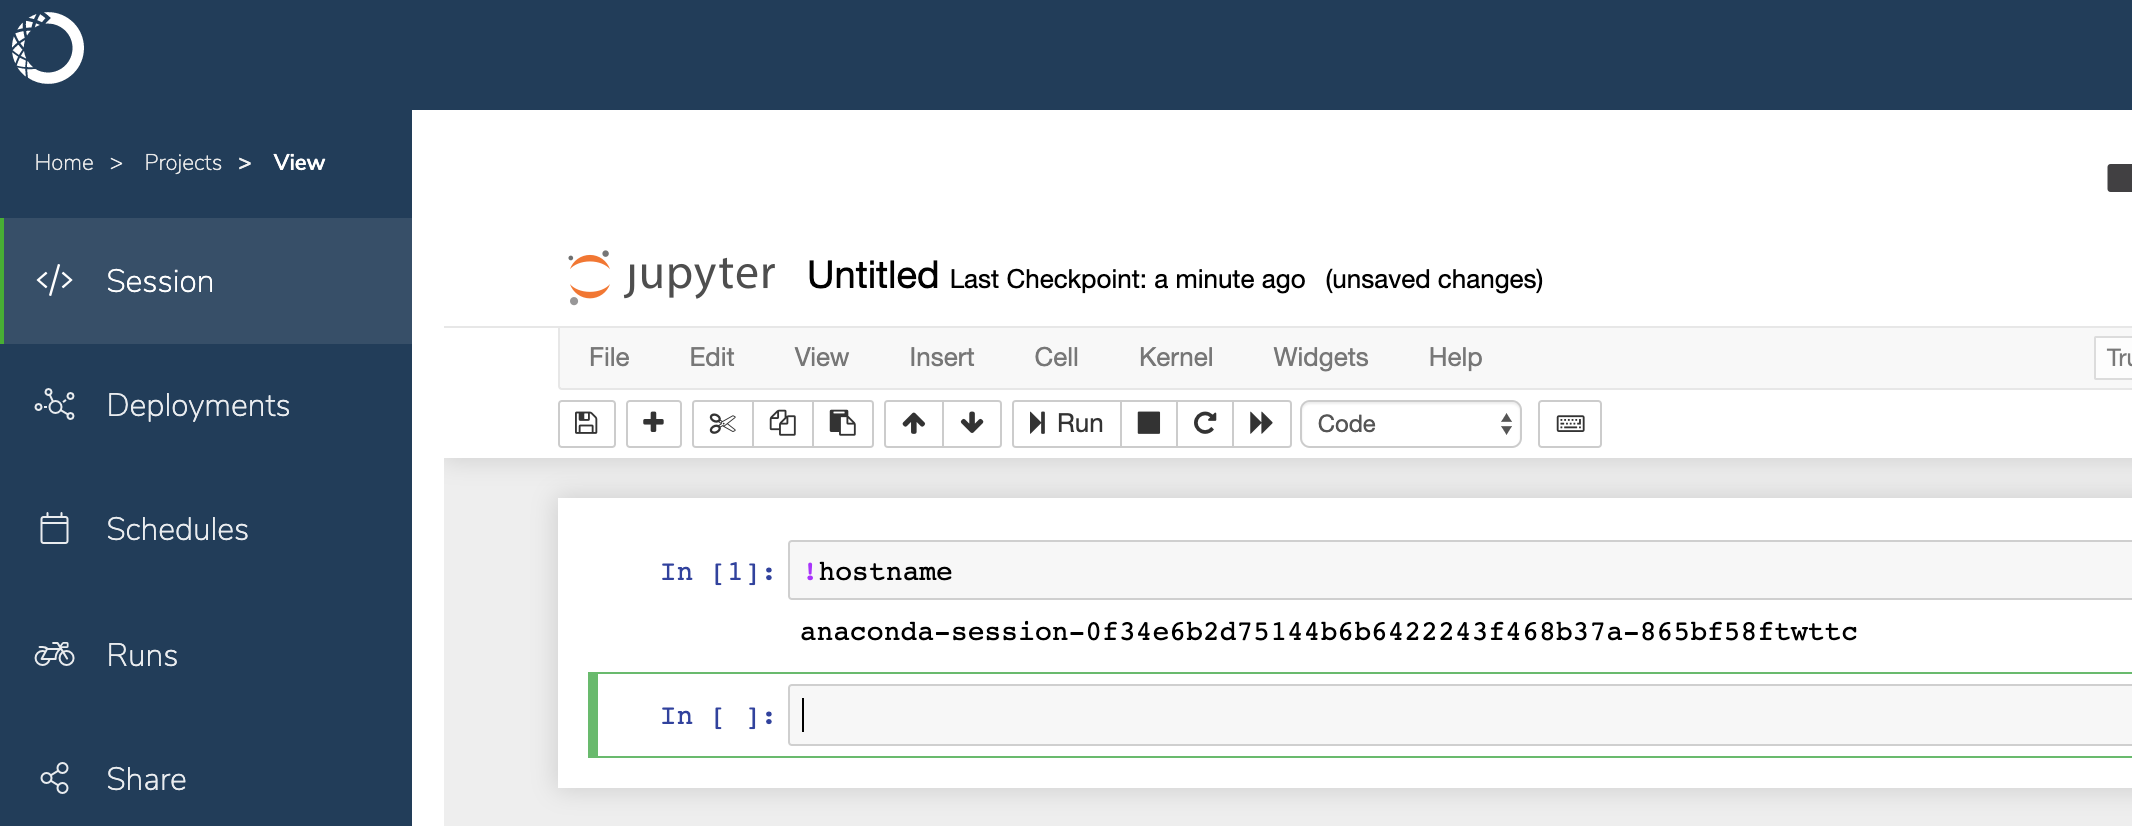
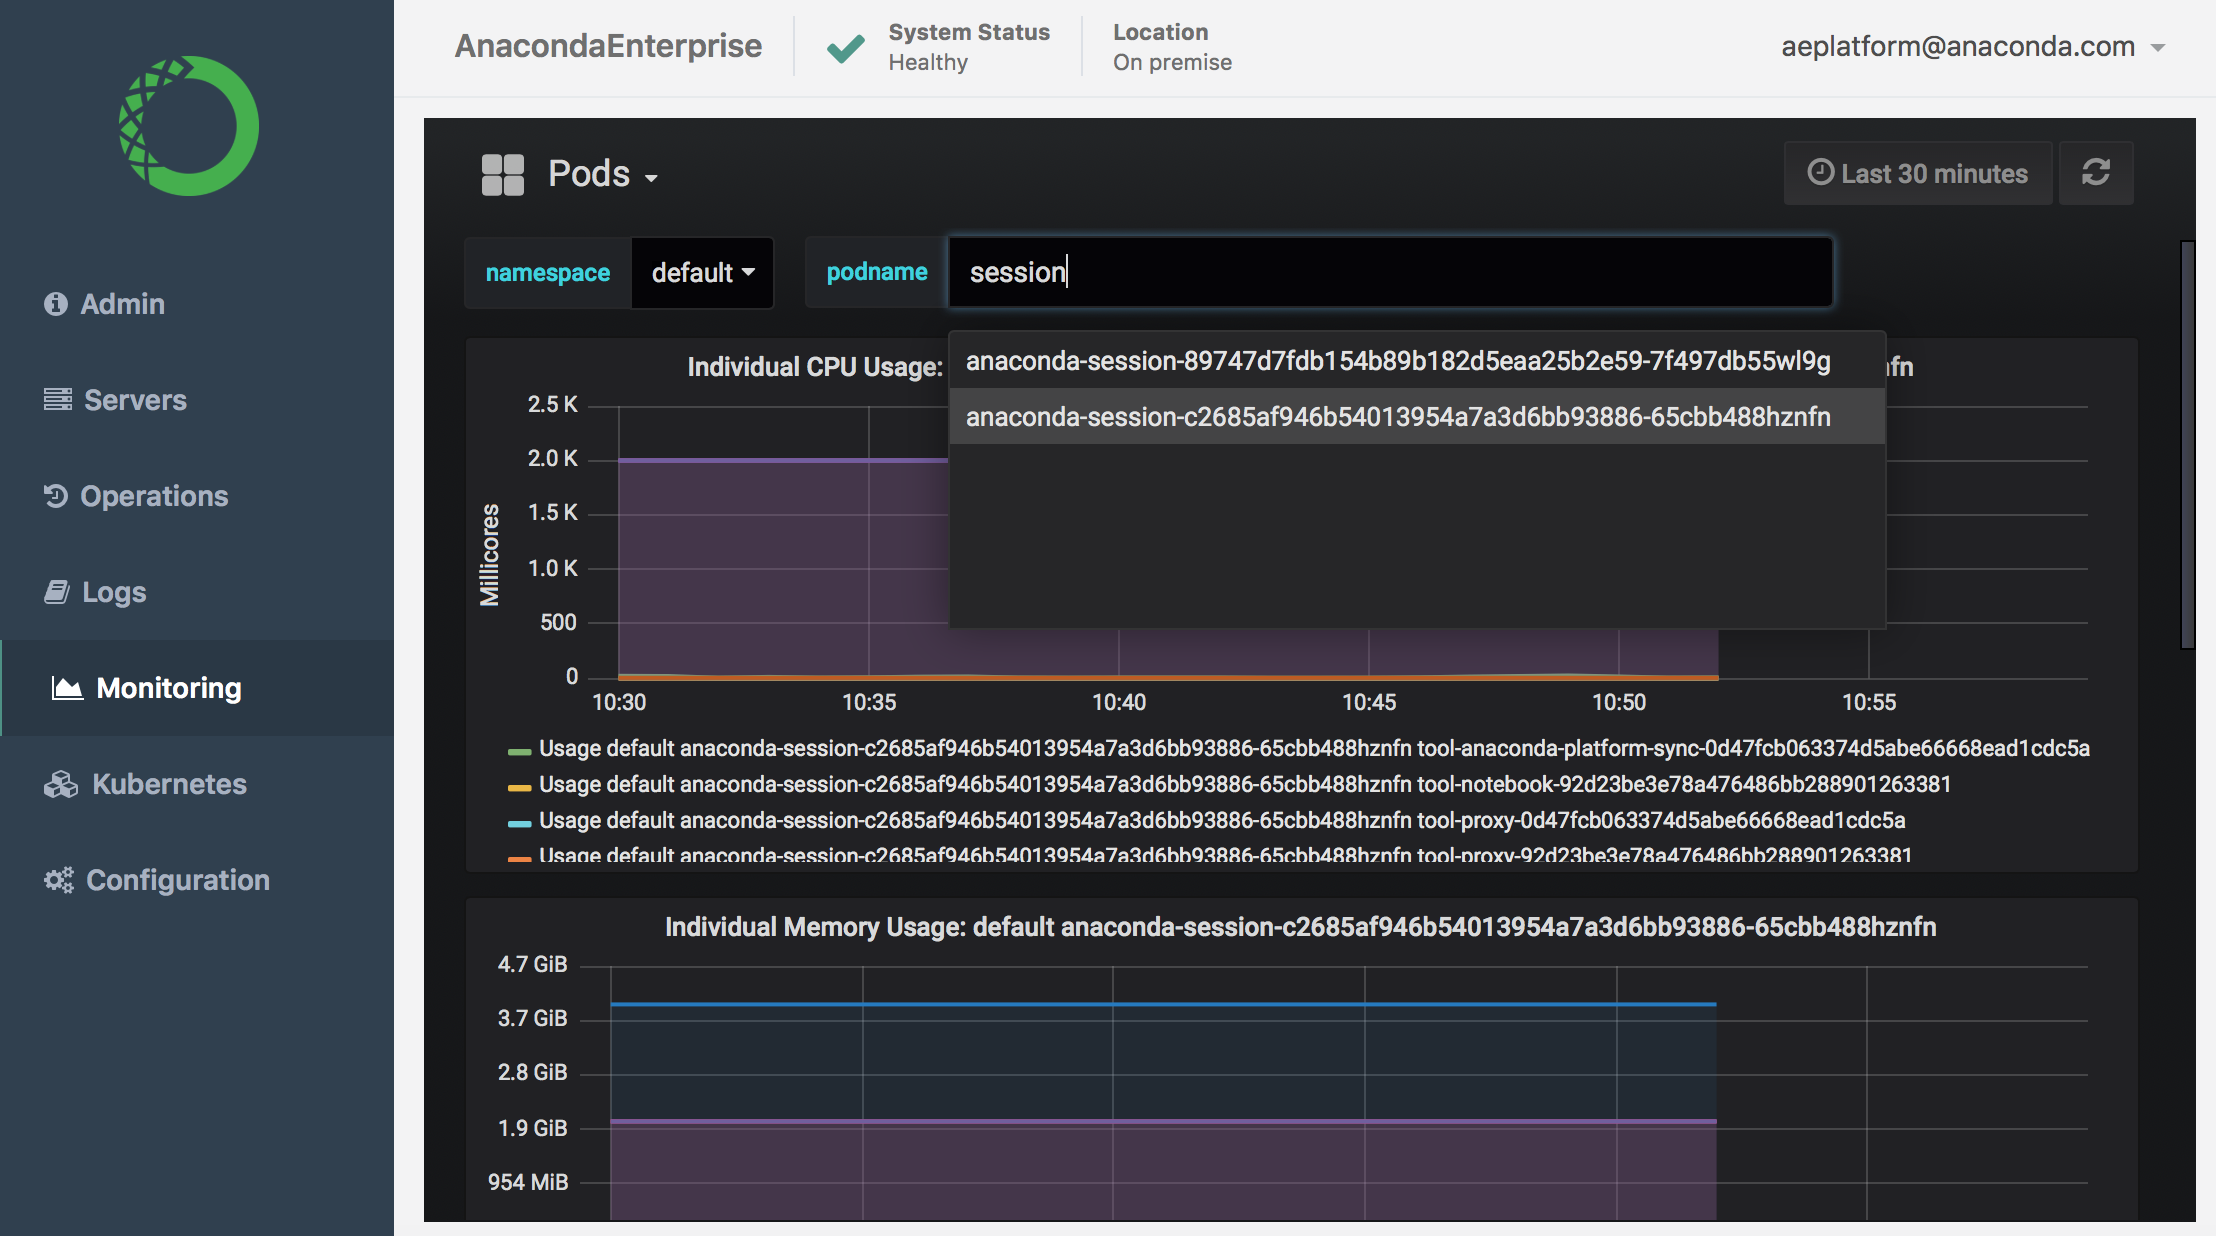
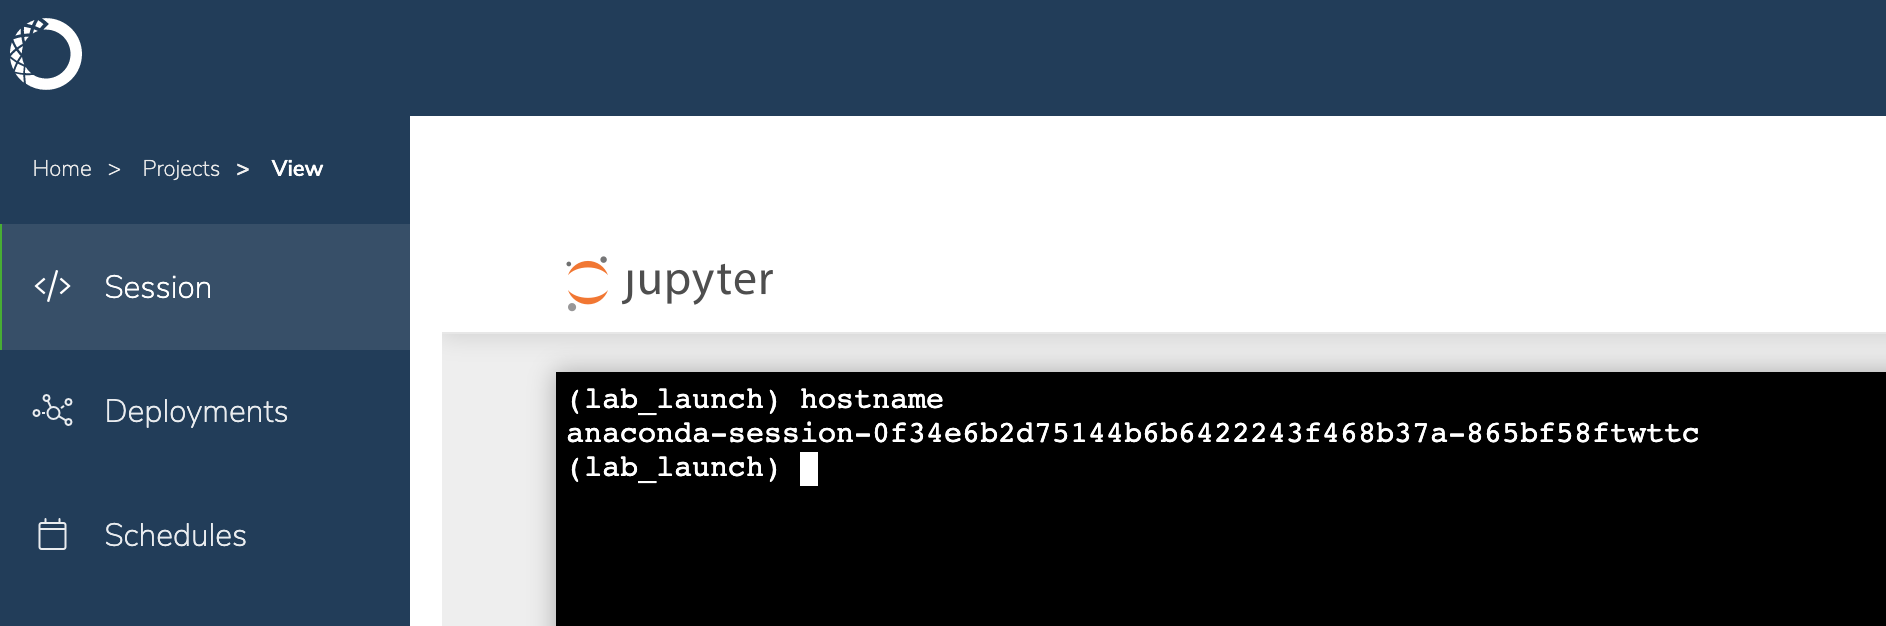 You can then use the commands described above or the Operation Center’s **Monitoring** and **Logs** features to investigate the issue. See [Monitoring sessions and deployments](/docs/data-science/latest/admin/resources/gravity/monitor-sessions-deps) for more information.
 As an Administrator, you can also use the Authentication Center to impersonate a user to try to reproduce the problem they are experiencing.
**To access the Authentication Center:**
1. Log in to Workbench, click **Menu** in the top right corner, then click the **Administrative Console** link in the bottom of the slideout menu.
2. Click **Manage Users**.
3. In the Manage menu on the left, click **Users**.
4. On the **Lookup** tab, click **View all users** to list every user in the system, or search the user database for all users that match the criteria you enter, based on their first name, last name, or email address.
As an Administrator, you can also use the Authentication Center to impersonate a user to try to reproduce the problem they are experiencing.
**To access the Authentication Center:**
1. Log in to Workbench, click **Menu** in the top right corner, then click the **Administrative Console** link in the bottom of the slideout menu.
2. Click **Manage Users**.
3. In the Manage menu on the left, click **Users**.
4. On the **Lookup** tab, click **View all users** to list every user in the system, or search the user database for all users that match the criteria you enter, based on their first name, last name, or email address.
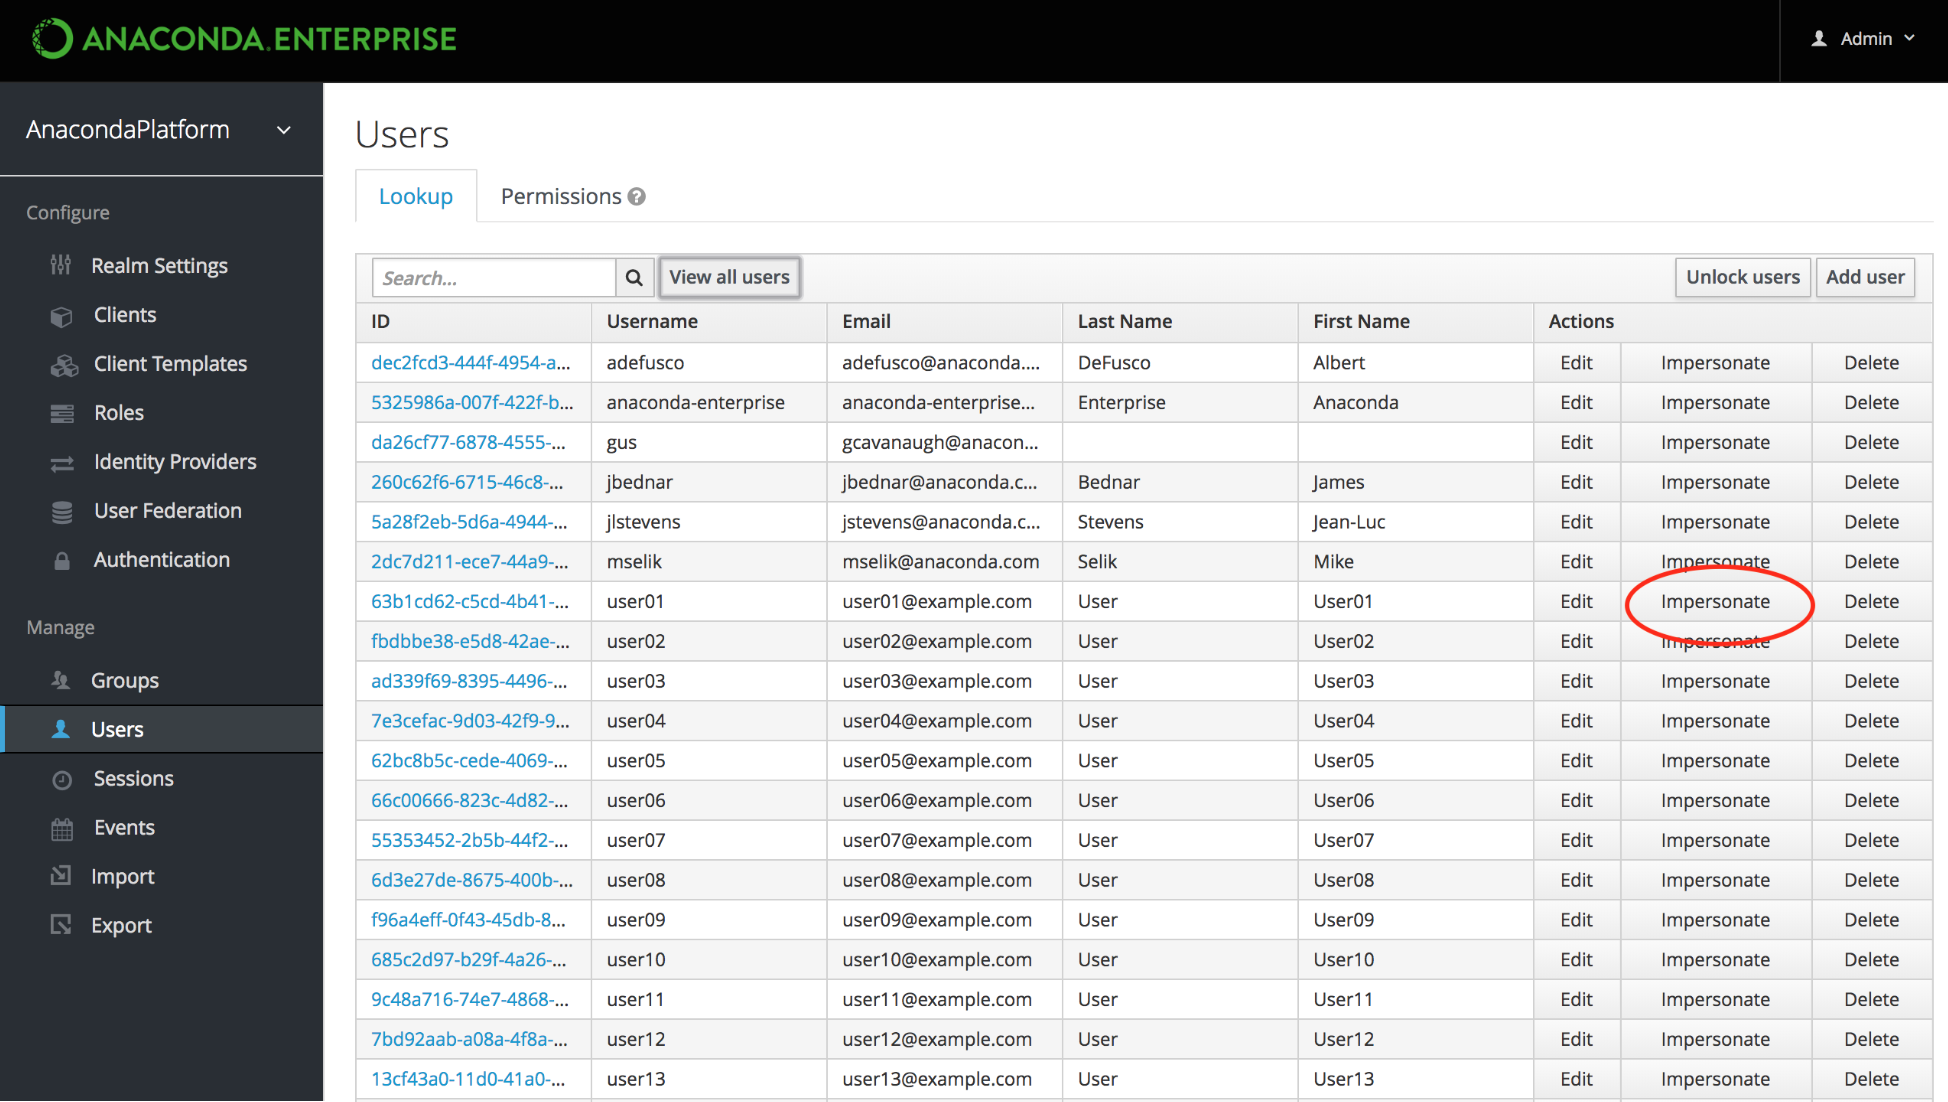 5. Click **Impersonate** in the row of **Actions** for the user to display a table of all **Applications** this user has interacted with on the platform, including editor sessions and deployments.
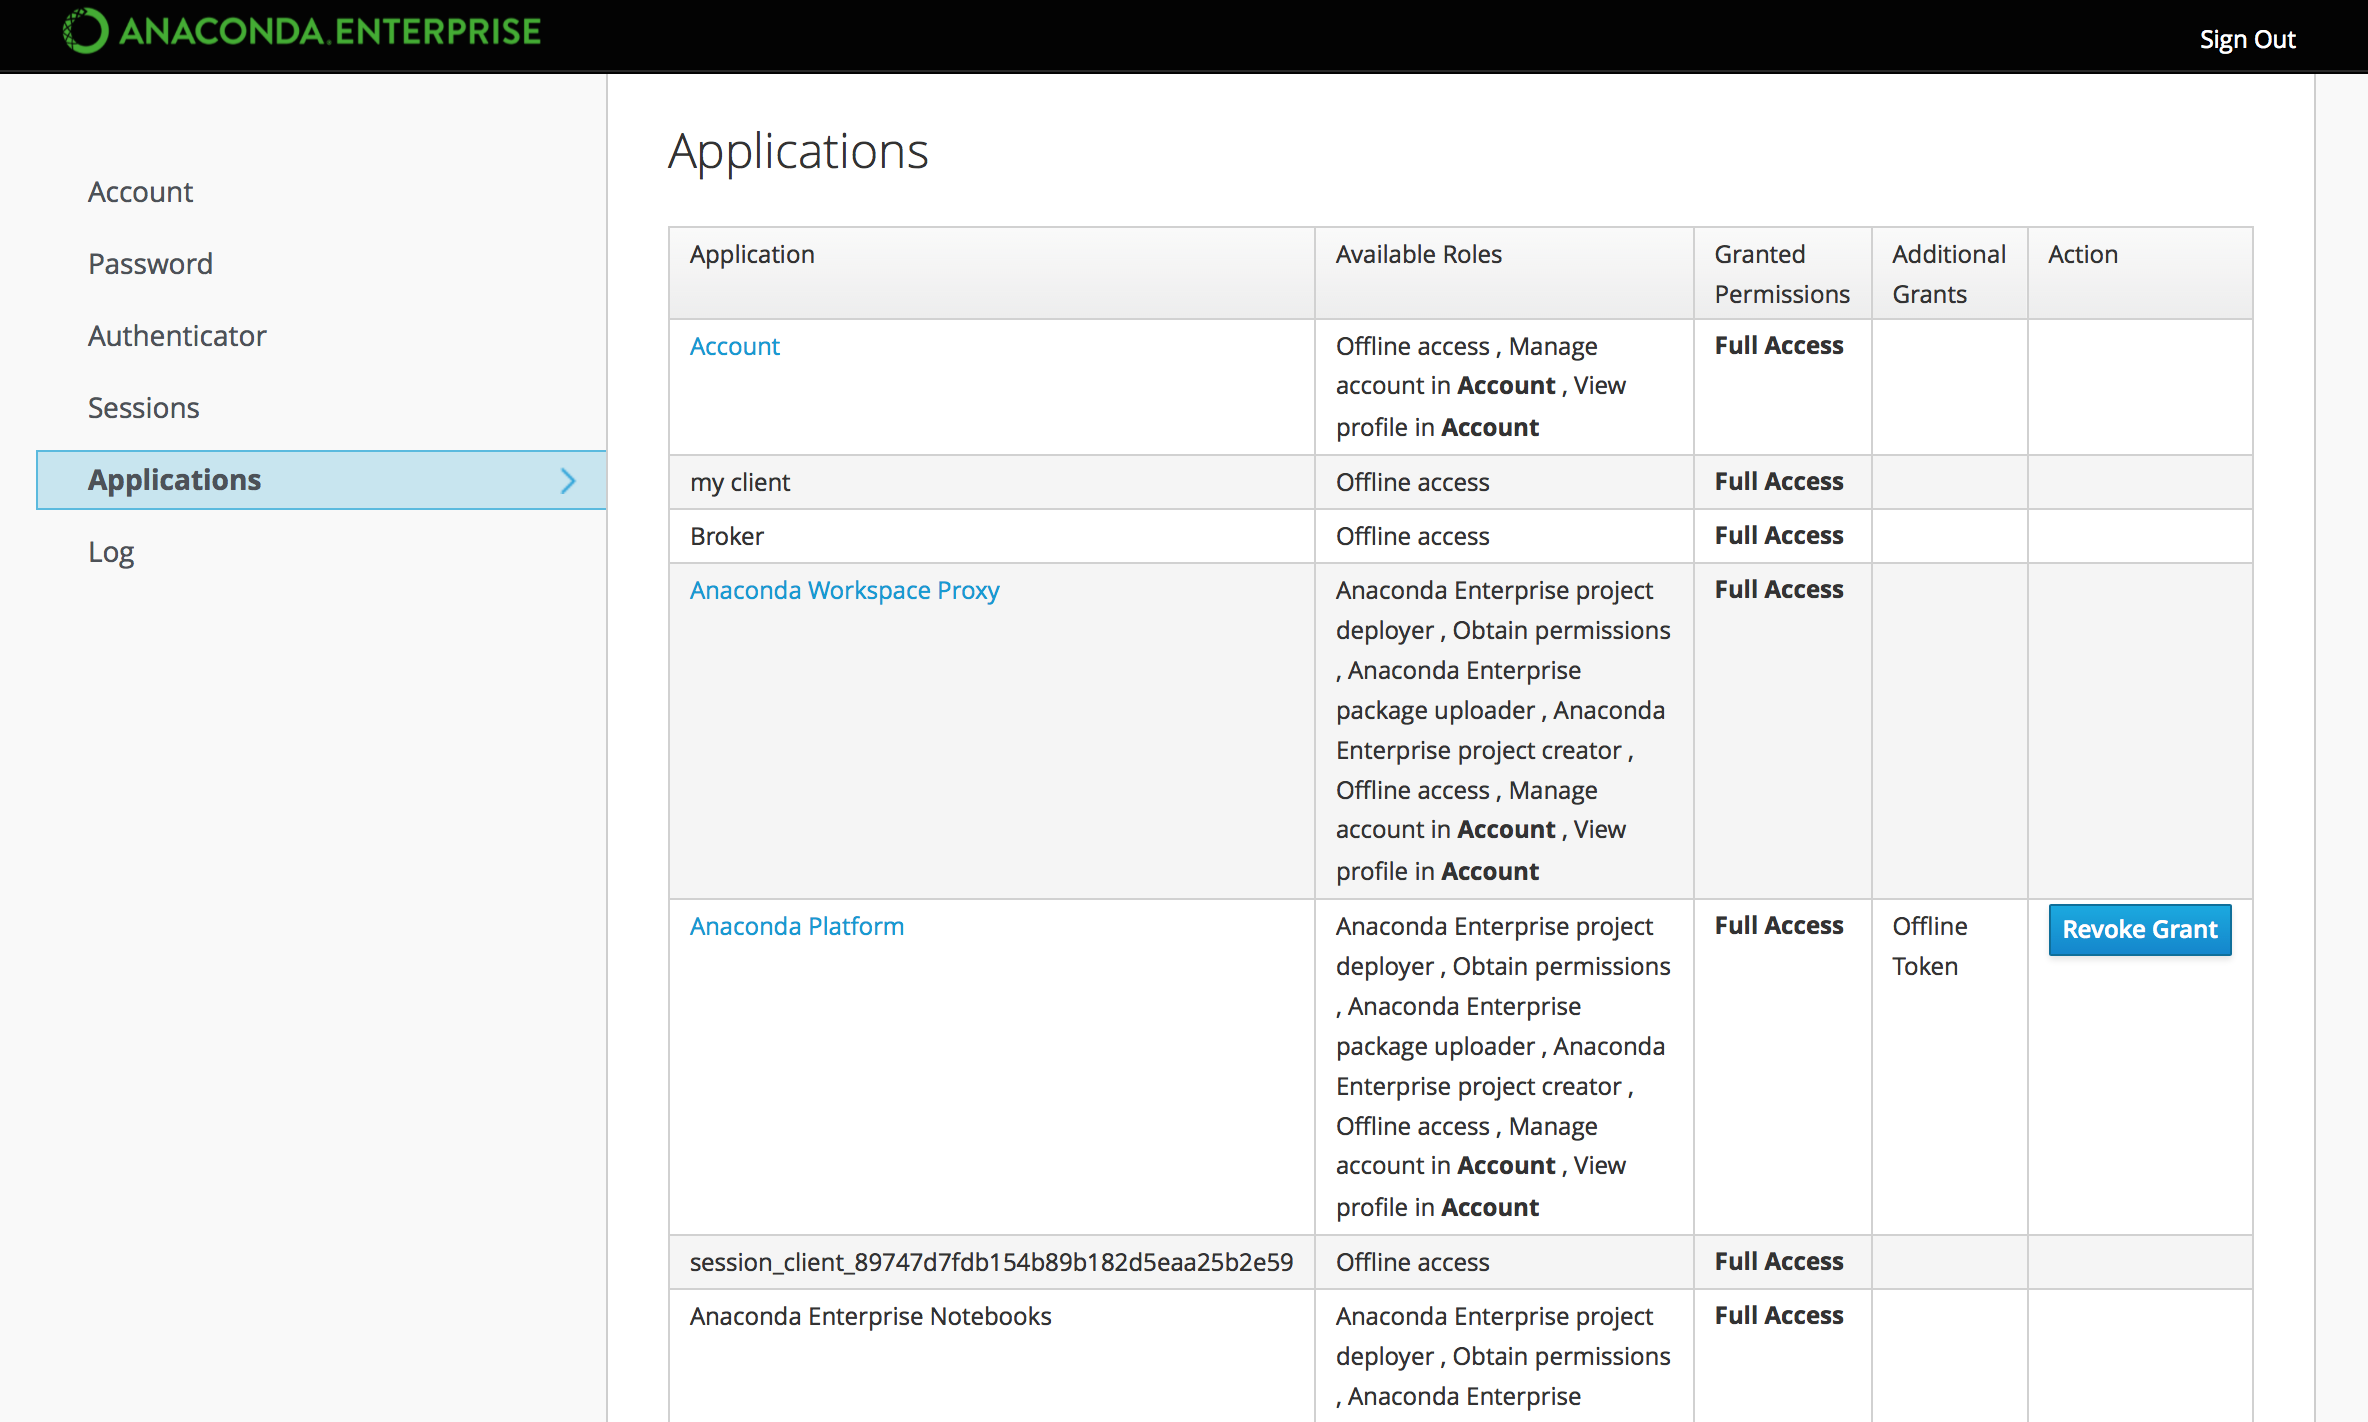 6. Click the **Anaconda Platform** link to interact with Workbench as the user.
See [Managing users](/docs/data-science/latest/admin/user-mgmt/users) for more information on managing users.
## Editor sessions
To help you troubleshoot issues with editor sessions, it might be helpful to understand what is happening "behind the scenes".
* When a user starts a session, Workbench launches the appropriate editor for them to work with their project files. In the background, the editor environment and other services are running in Docker containers.
* To improve startup time for projects, the editor container includes conda environments for each of the [project template environments](/docs/data-science/latest/data-science-workflows/projects/project-templates) provided by the platform. These environments are stored in `/opt/continuum/anaconda/envs`, along with any custom environments created *during the editor session*.
* The project repository is cloned into `/opt/continuum/project`. (Only changes to files in this directory can be saved to the repository.)
* The `anaconda-project prepare` command runs, scans the project's `anaconda-project.yml` file for new packages and environments, and installs them into the running session.
During this phase, you can monitor the progress by watching the output of `/opt/continuum/preparing`.
When this process completes, the `/opt/continuum/prepare.log` is created.
Any changes made to the container image will be lost when the session stops, so any packages installed from the command line are available during the current session only. To persist package installs across sessions, they must be added to the project's `anaconda-project.yml` file.
6. Click the **Anaconda Platform** link to interact with Workbench as the user.
See [Managing users](/docs/data-science/latest/admin/user-mgmt/users) for more information on managing users.
## Editor sessions
To help you troubleshoot issues with editor sessions, it might be helpful to understand what is happening "behind the scenes".
* When a user starts a session, Workbench launches the appropriate editor for them to work with their project files. In the background, the editor environment and other services are running in Docker containers.
* To improve startup time for projects, the editor container includes conda environments for each of the [project template environments](/docs/data-science/latest/data-science-workflows/projects/project-templates) provided by the platform. These environments are stored in `/opt/continuum/anaconda/envs`, along with any custom environments created *during the editor session*.
* The project repository is cloned into `/opt/continuum/project`. (Only changes to files in this directory can be saved to the repository.)
* The `anaconda-project prepare` command runs, scans the project's `anaconda-project.yml` file for new packages and environments, and installs them into the running session.
During this phase, you can monitor the progress by watching the output of `/opt/continuum/preparing`.
When this process completes, the `/opt/continuum/prepare.log` is created.
Any changes made to the container image will be lost when the session stops, so any packages installed from the command line are available during the current session only. To persist package installs across sessions, they must be added to the project's `anaconda-project.yml` file.