> ## Documentation Index
> Fetch the complete documentation index at: https://anaconda.com/docs/llms.txt
> Use this file to discover all available pages before exploring further.
# Viewing system logs
To help you gain insights into user services and troubleshoot issues, Data Science & AI Workbench provides detailed logs and debugging information related to the Kubernetes services and containers it uses.
**To access these logs from the Operations Center:**
1. Log in to Workbench, select **Menu** in the top right corner, and click the **Administrative Console** link displayed at the bottom of the slide out window.
2. Click **Manage Resources**.
3. Log in to the Operations Center using the Administrator credentials [configured after installation](/docs/data-science/latest/install/config).
4. Click **Logs** in the left menu to display the complete system log.
5. Use the **Filter** drop-down to view logs based on a container.
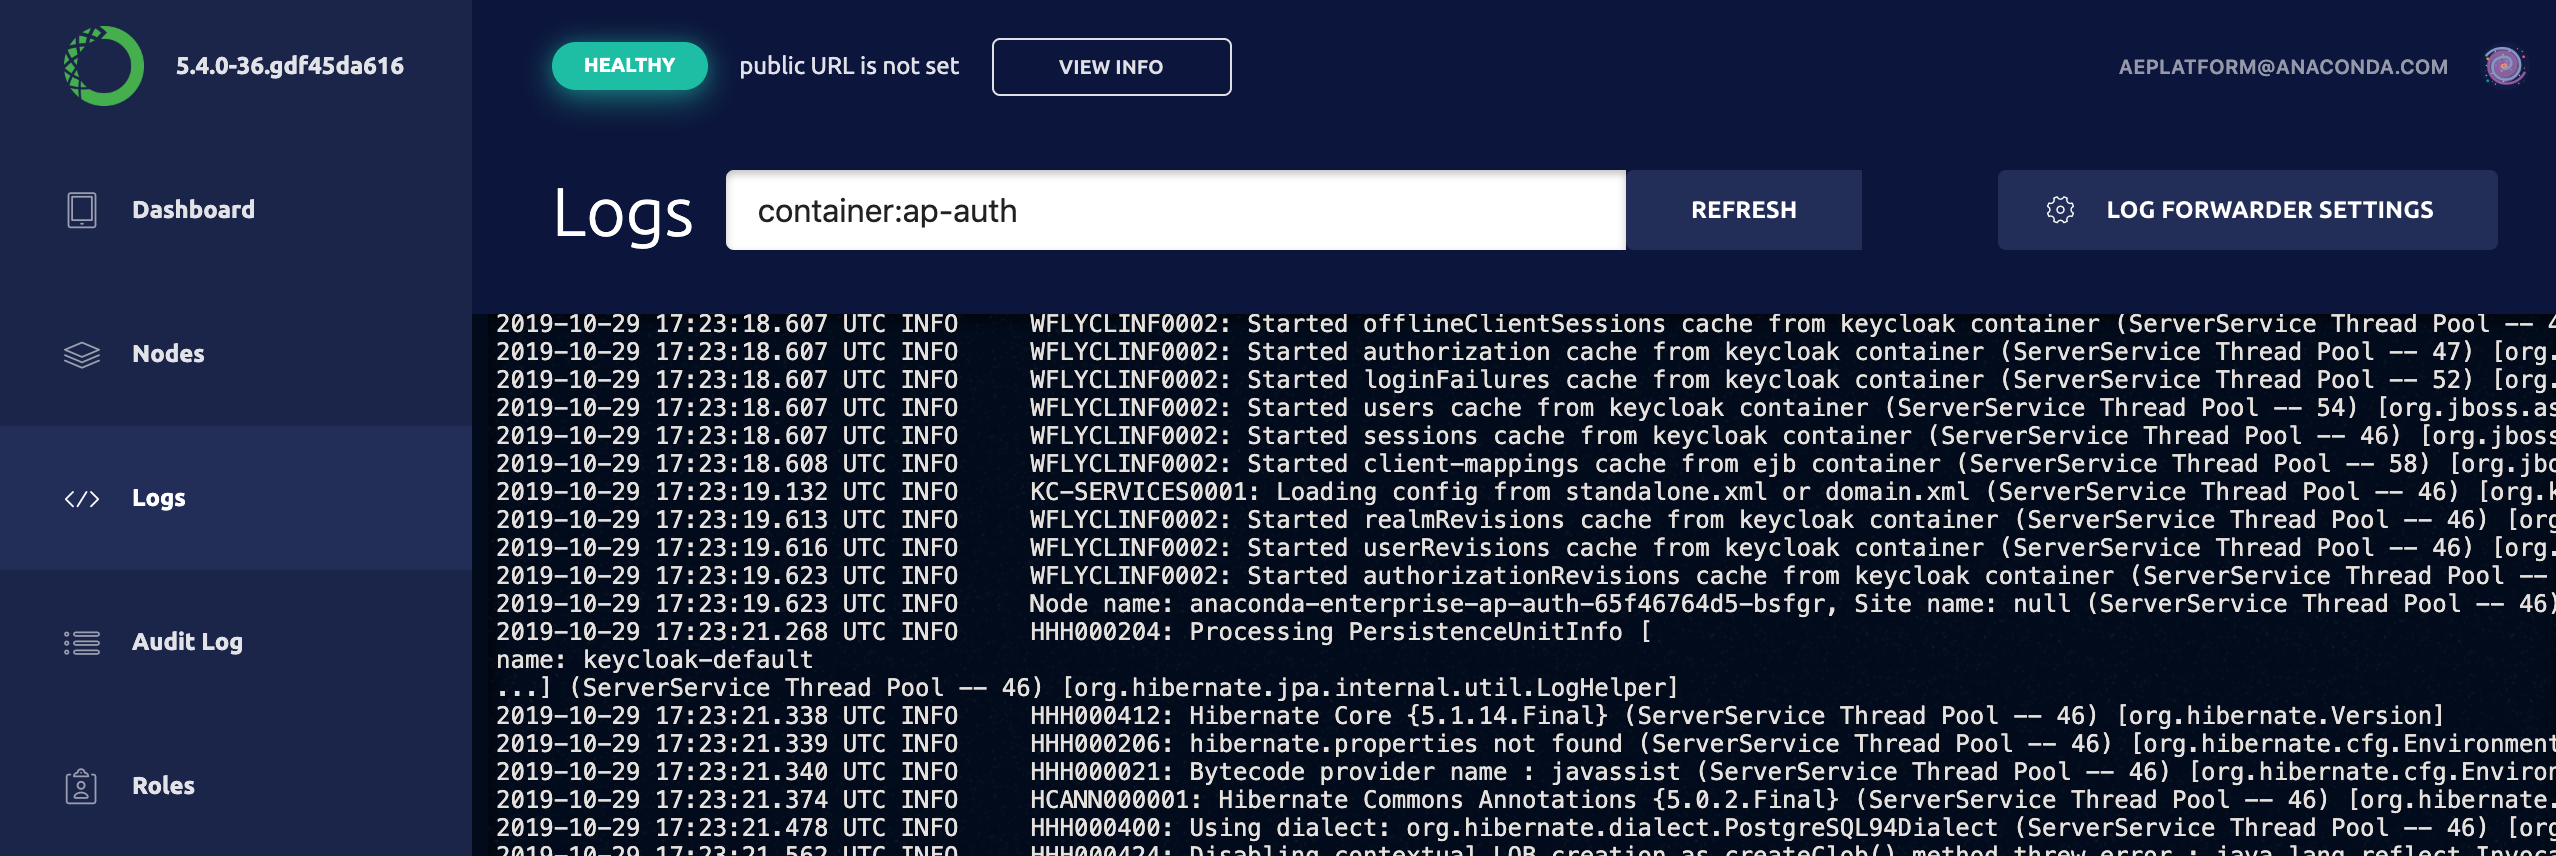 You can also access the logs for a specific pod by clicking **Kubernetes** in the left menu, clicking the **Pods** tab, clicking the name of a pod, and selecting **Logs**.
## Individual pods
To display the logs for a user session or deployment you’ll need to identify the appropriate Kubernetes pod name.
For an editor session the Kubernetes pod name corresponds to the hostname of the session container. Run `hostname` in a terminal window. For deployments the pod name is available from the logs tab of the deployment under the heading **name**.
1. Click the **Kubernetes** tab from the menu on the left.
2. Click the **Pods** tab to display a list of all pods and containers. Editor sessions are named `anaconda-session-XXXXX` and deployments are named `anaconda-app-XXXX`.
You can also access the logs for a specific pod by clicking **Kubernetes** in the left menu, clicking the **Pods** tab, clicking the name of a pod, and selecting **Logs**.
## Individual pods
To display the logs for a user session or deployment you’ll need to identify the appropriate Kubernetes pod name.
For an editor session the Kubernetes pod name corresponds to the hostname of the session container. Run `hostname` in a terminal window. For deployments the pod name is available from the logs tab of the deployment under the heading **name**.
1. Click the **Kubernetes** tab from the menu on the left.
2. Click the **Pods** tab to display a list of all pods and containers. Editor sessions are named `anaconda-session-XXXXX` and deployments are named `anaconda-app-XXXX`.
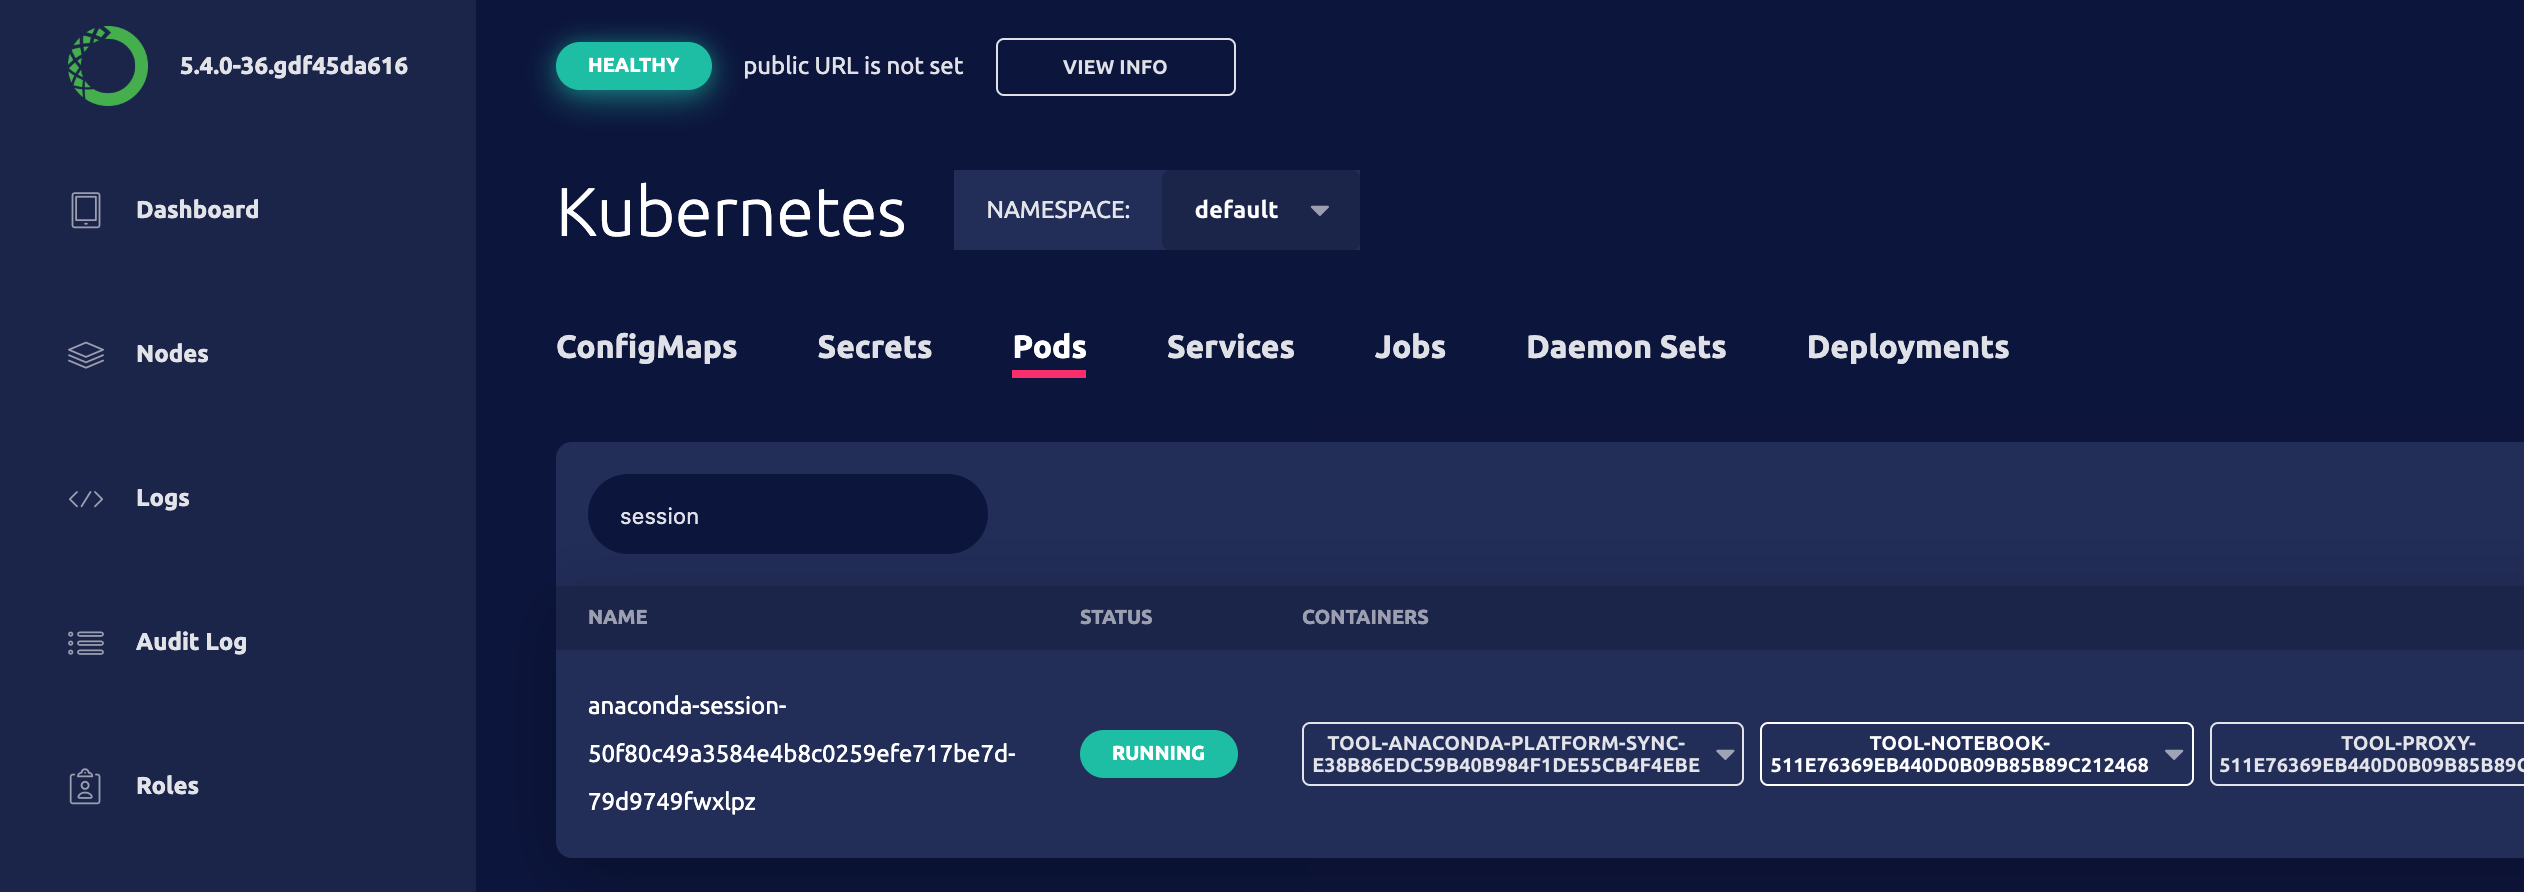 1. For the chosen pod click the pull-down button on an individual container to view the **Logs** or to gain SSH access.
 **To use the CLI:**
1. Open an SSH session on the master node in a terminal by logging into the Operations Center and selecting **Servers** from the menu on the left.
2. Click on the IP address for the Workbench master node and select SSH login as **root**.
3. In the terminal window, run `sudo gravity enter`.
4. Run `kubectl get pods` to view a list of all running session pods.
5. Run `kubectl logs ` to display the logs for the pod specified.
**To use the CLI:**
1. Open an SSH session on the master node in a terminal by logging into the Operations Center and selecting **Servers** from the menu on the left.
2. Click on the IP address for the Workbench master node and select SSH login as **root**.
3. In the terminal window, run `sudo gravity enter`.
4. Run `kubectl get pods` to view a list of all running session pods.
5. Run `kubectl logs ` to display the logs for the pod specified.