> ## Documentation Index
> Fetch the complete documentation index at: https://anaconda.com/docs/llms.txt
> Use this file to discover all available pages before exploring further.
# Monitoring sessions and deployments
Anaconda Enterprise enables you to see which sessions and deployments are
running on specific nodes or by specific users, so you can monitor cluster
resource usage. You can also view session details *for a specific user* in the
Authorization Center. See [Managing users](../user-mgmt/users) for more
information.
1. Log in to Anaconda Enterprise, select the **Menu** icon in the top
right corner and click the **Administrative Console** link displayed at the
bottom of the slide out window.
2. Click **Manage Resources**.
3. Log in to the Operations Center using the Administrator credentials
[configured after installation](../../install/config).
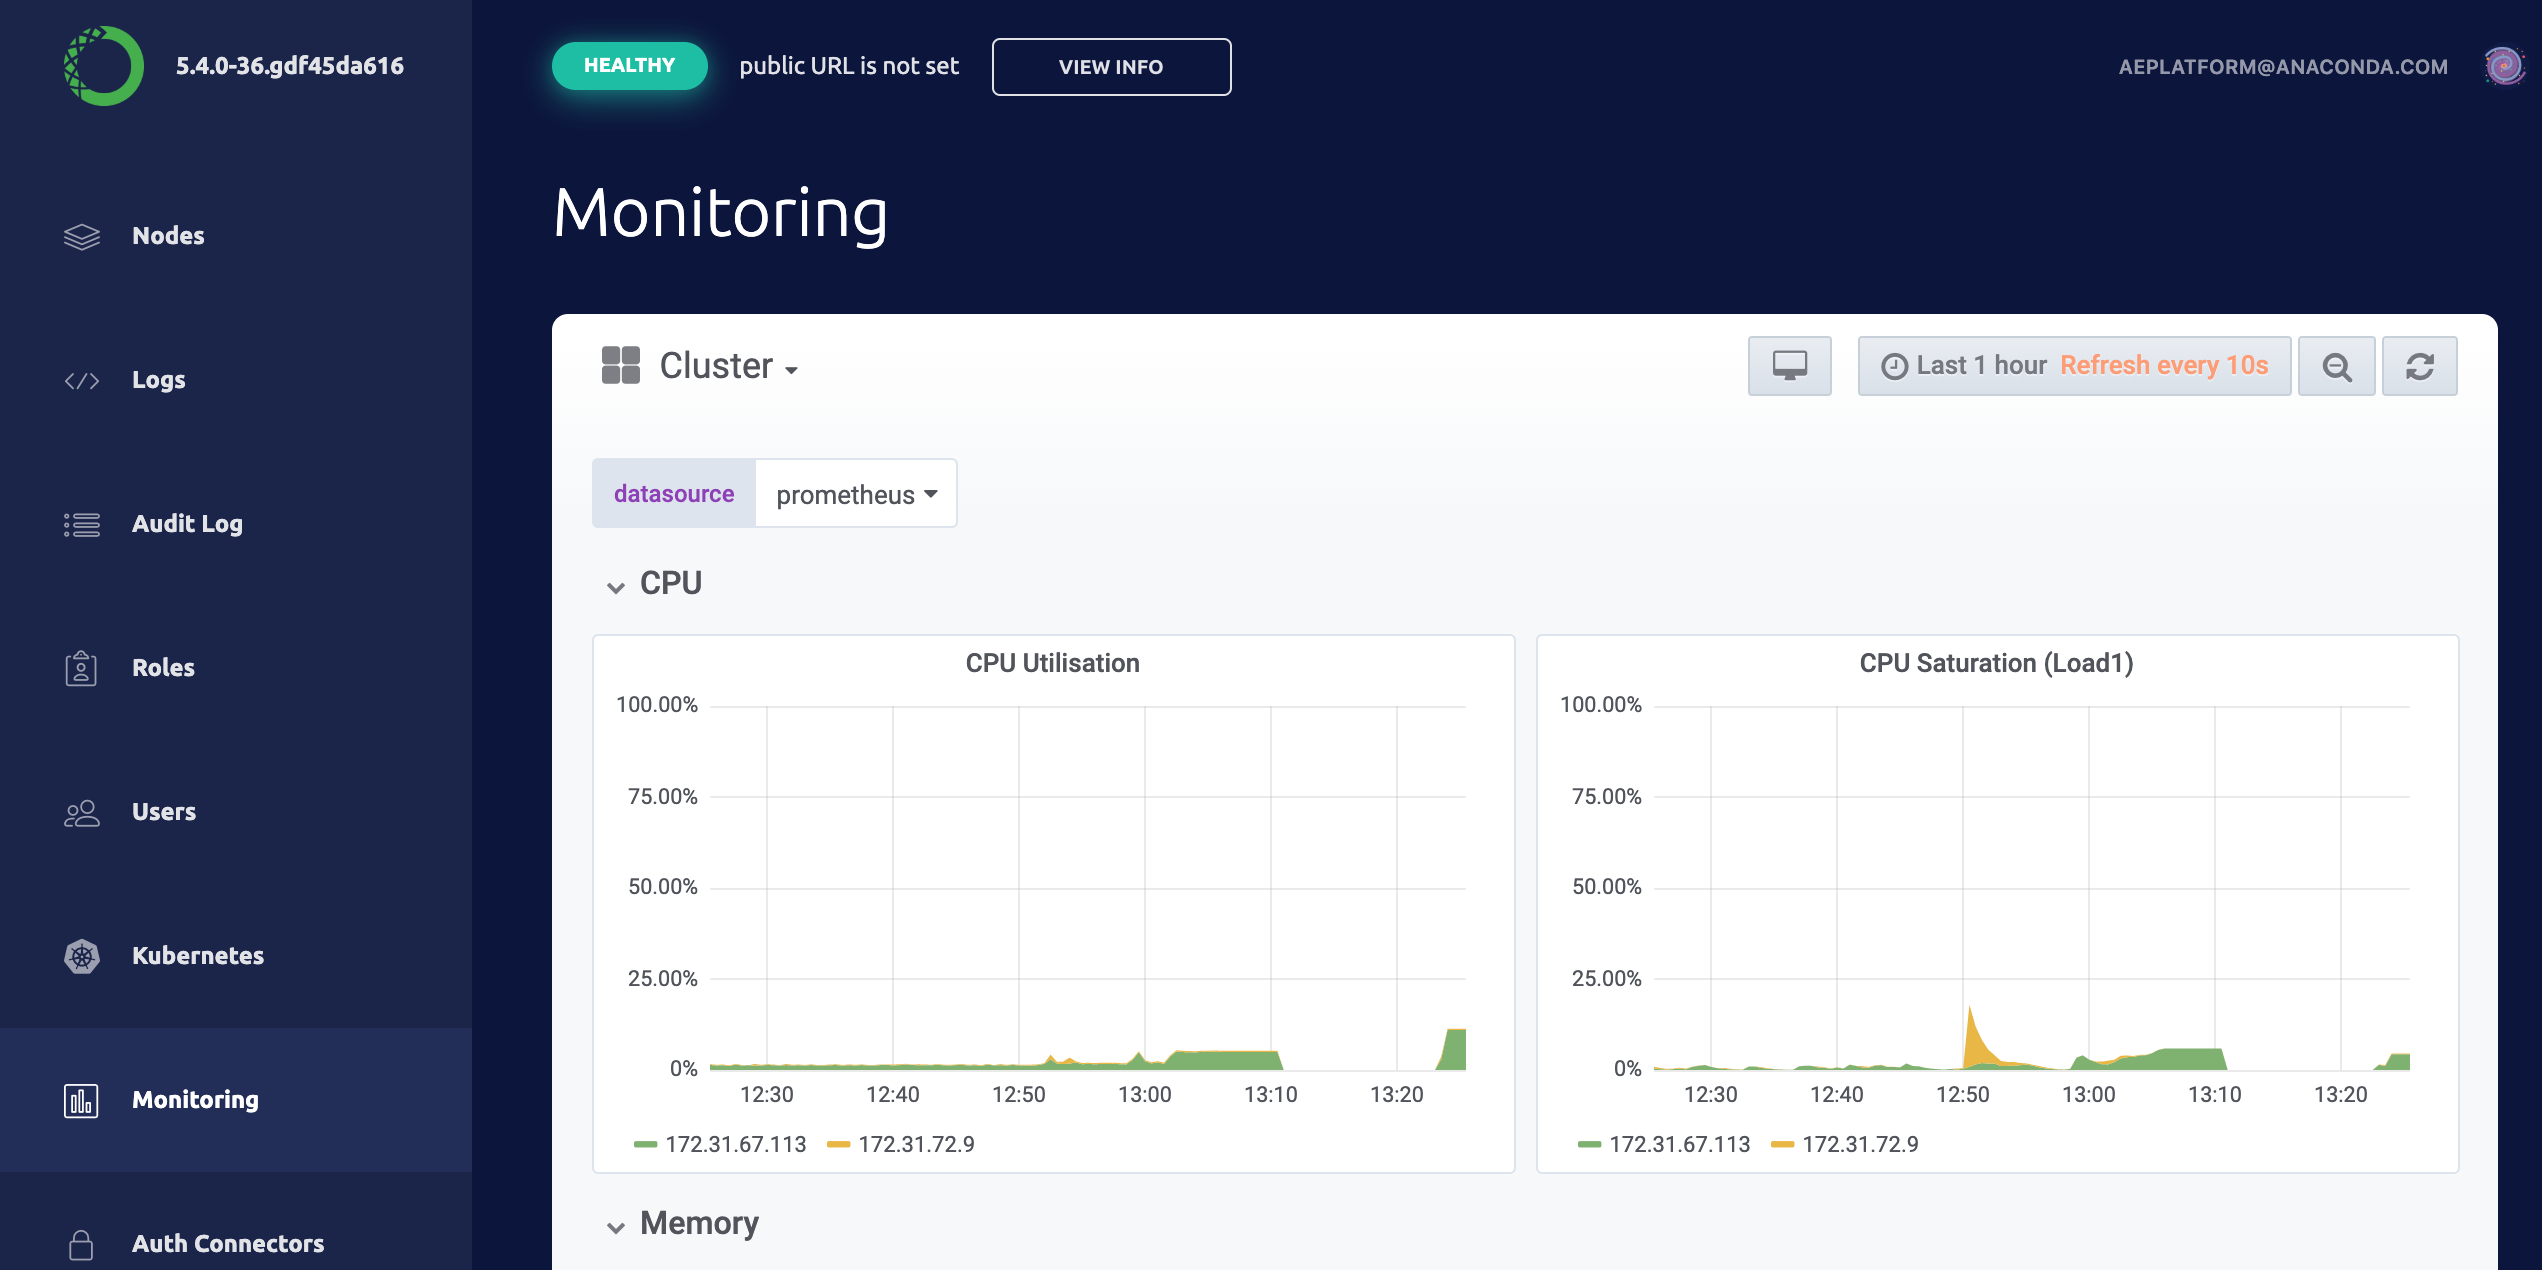
4. Select **Monitoring** from the menu on the left to display the monitoring
dashboards.
 ## Individual pod
To display the monitoring graph for a user session or deployment you’ll
need to identify the appropriate Kubernetes pod name.
For an editor session the Kubernetes pod name corresponds to the hostname
of the session container. Run `hostname` in a terminal window. For
deployments the pod name is available from the logs tab of the deployment
under the heading **name**.
1. Click the **Monitoring** tab from the menu on the left
2. Click **Cluster** at the top left of the dashboard
3. Select **Compute Resource / Workload**
## Individual pod
To display the monitoring graph for a user session or deployment you’ll
need to identify the appropriate Kubernetes pod name.
For an editor session the Kubernetes pod name corresponds to the hostname
of the session container. Run `hostname` in a terminal window. For
deployments the pod name is available from the logs tab of the deployment
under the heading **name**.
1. Click the **Monitoring** tab from the menu on the left
2. Click **Cluster** at the top left of the dashboard
3. Select **Compute Resource / Workload**
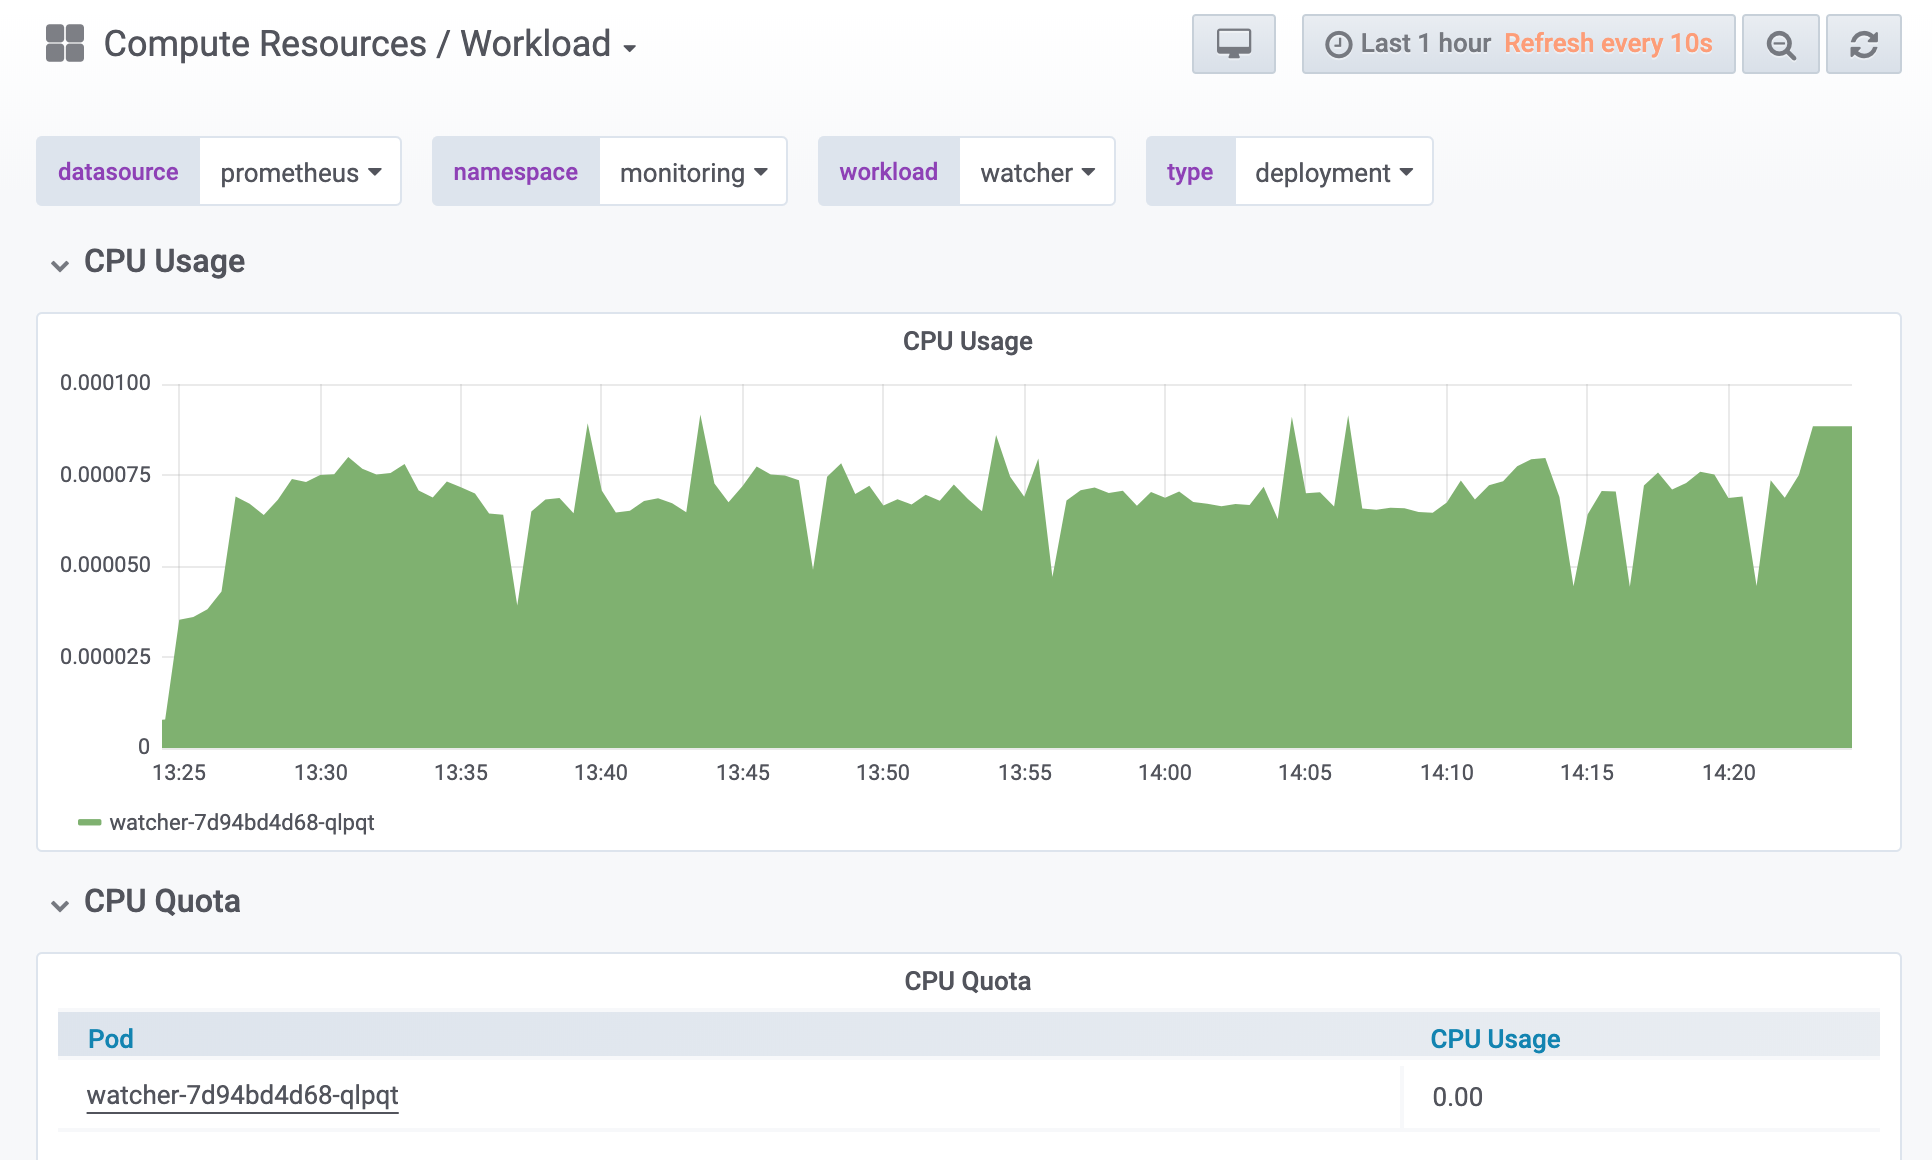 To display the monitoring graph for an individual pod
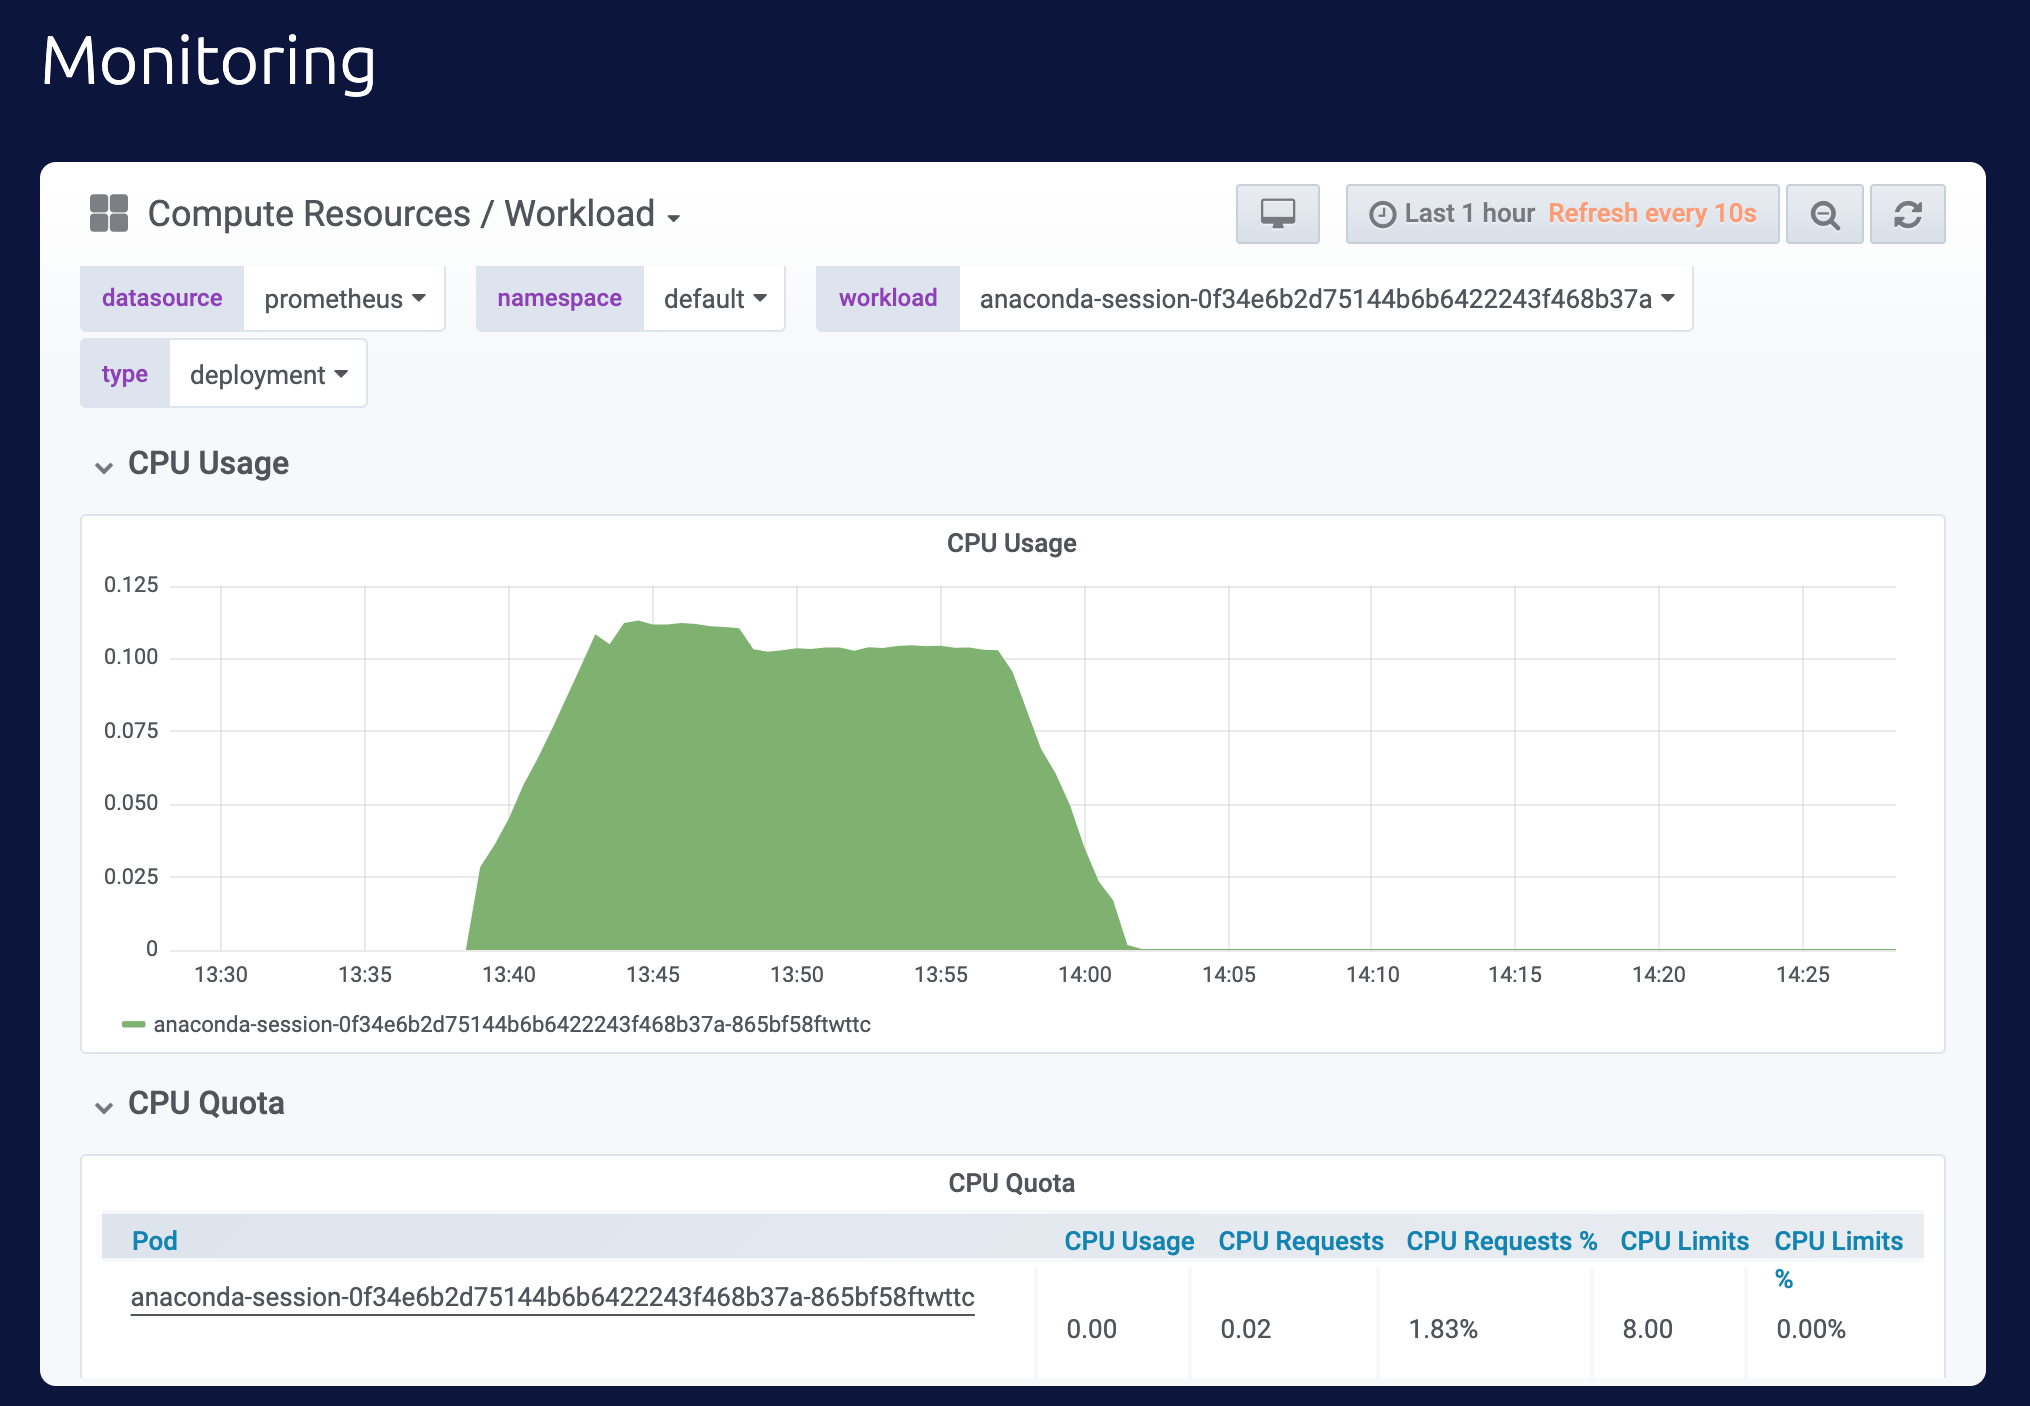
1. Select `default` from the **namespace** menu
2. Select the preferred pod from the the **workload** menu
To display the monitoring graph for an individual pod
1. Select `default` from the **namespace** menu
2. Select the preferred pod from the the **workload** menu
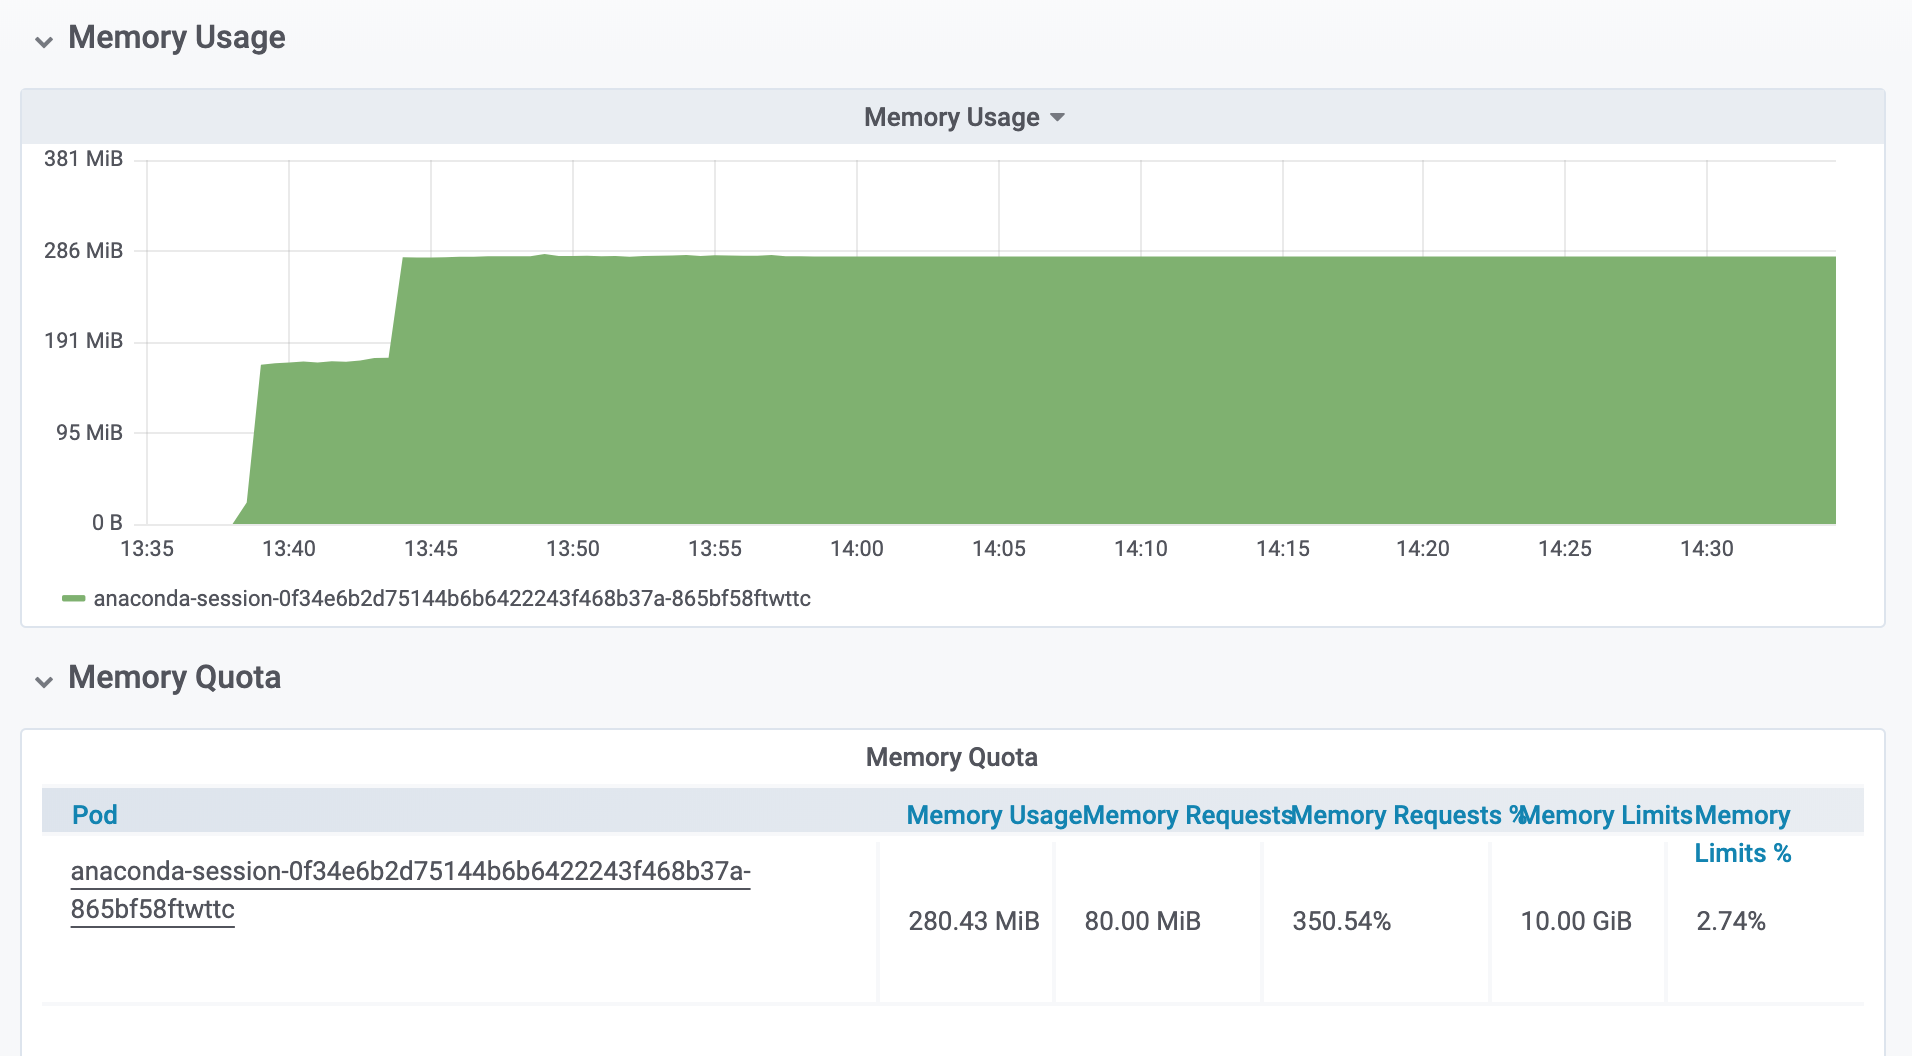
 Scroll down further to display the memory usage.
 **Using the CLI:**
1. Open an SSH session on the master node in a terminal by logging into the
Operations Center and selecting **Servers** from the menu on the left.
2. Click on the IP address for the Anaconda Enterprise master node and select
SSH login as **root**.
3. In the terminal window, run `sudo gravity enter`.
To view total node CPU and memory utilization run
```
kubectl top nodes --heapster-namespace=monitoring
```
To view CPU and memory utilization per pod run
```
kubectl top pods --heapster-namespace=monitoring
```
**Using the CLI:**
1. Open an SSH session on the master node in a terminal by logging into the
Operations Center and selecting **Servers** from the menu on the left.
2. Click on the IP address for the Anaconda Enterprise master node and select
SSH login as **root**.
3. In the terminal window, run `sudo gravity enter`.
To view total node CPU and memory utilization run
```
kubectl top nodes --heapster-namespace=monitoring
```
To view CPU and memory utilization per pod run
```
kubectl top pods --heapster-namespace=monitoring
```